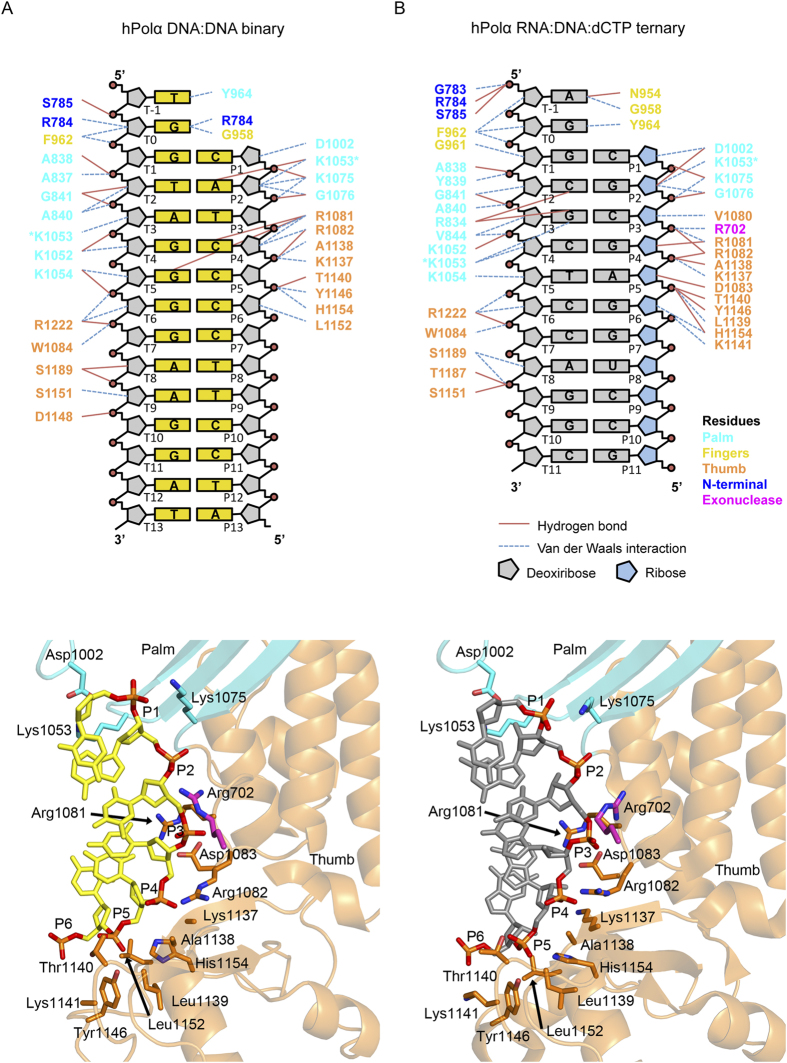
Figure 5. Protein-nucleic acid interactions.
(A) Top, a schematic drawing of protein-DNA interactions in the hPolα binary complex. Residues from the palm are colored in cyan, from the thumb in orange, from the exonuclease in magenta, from the N-terminal in blue, and from the fingers in yellow. Only direct contacts between the protein and the nucleic acid are shown. Hydrogen bonds are indicated with blue lines (determined by interaction distances <3.2 Å), and van der Waals interactions are indicated with brown lines (determined by interaction distance <4.2 Å). The residues marked with an asterisk are represented more than once in the diagram. Templates bases are labeled T-1 to T13 and primer bases P1 to P13. Bottom, a view of the DNA primer interacting with residues from the palm and thumb domains. (B) Top, a schematic drawing of protein-DNA and protein-RNA interactions in the hPolα ternary complex with incoming dCTP (PDB code 4 QCL). The deoxyriboses are colored gray and the riboses are colored blue. Bottom, a view of the RNA primer interacting with residues from the palm and thumb domains.

