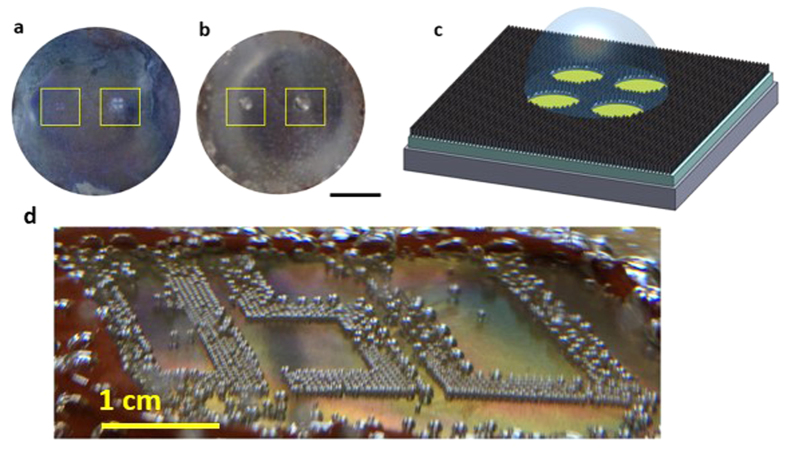
Figure 5. Controlled bubble nucleation site location.
Optical images of (a)Printing patterns (200–750 μm and 1,000–750 μm) of single controlled site surface. (b) Single bubble nucleation with different sizes on two single sites at heat flux I (scale bar = 1 cm). (c), Scheme to control single bubble site, stabilized by a four dot hydrophobic polymer dot array and dense ZnO nanowire matrix. (d) OSU-patterned bubble nucleation arrays (scale bar = 1 cm). Videos of bubble nucleation, growth and departure are provided in the supplementary material.

