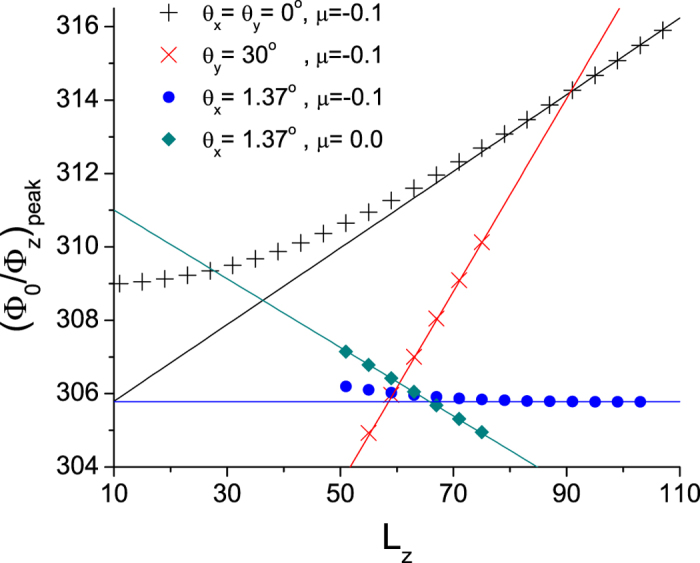
Figure 4. Symbols mark the location of one of the density of states peaks as a function of the slab thickness Lz at different chemical potential μ and magnetic field tilting angle θy or θx.

The lines are the asymptotic expression in the large Lz limit derived from the positions of and the Fermi velocity around the Weyl nodes in the bulk:  for a magnetic field in the
  direction, and refer to Supplementary information for the expressions in the presence of a tilted magnetic field. While the peak positions typically show strong Lz dependence, notably, for particular ‘magic’ angles (blue circles), the peak positions asymptotically become nearly independent of sample thickness.
