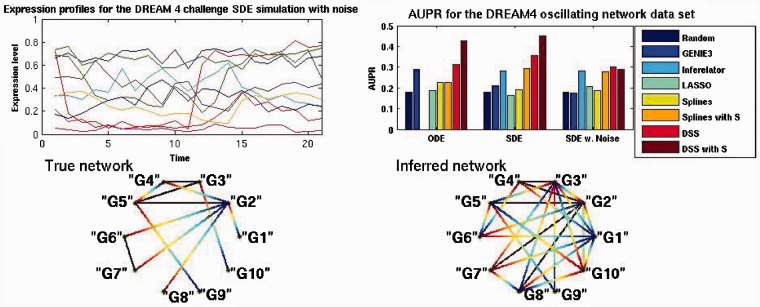
Fig. 3.
Top left is the expression profiles for the SDE model with experimental noise, node ‘G9’ in red presents a perturbation over half the time points. Top right is the AUPR values for the three simulation models. Bottom left is the true network topology, gradient lines represent regulation, solid lines represent bidirectional regulation. Bottom right is the inferred network obtained by setting a threshold of 0.5 over the inferred matrix H

