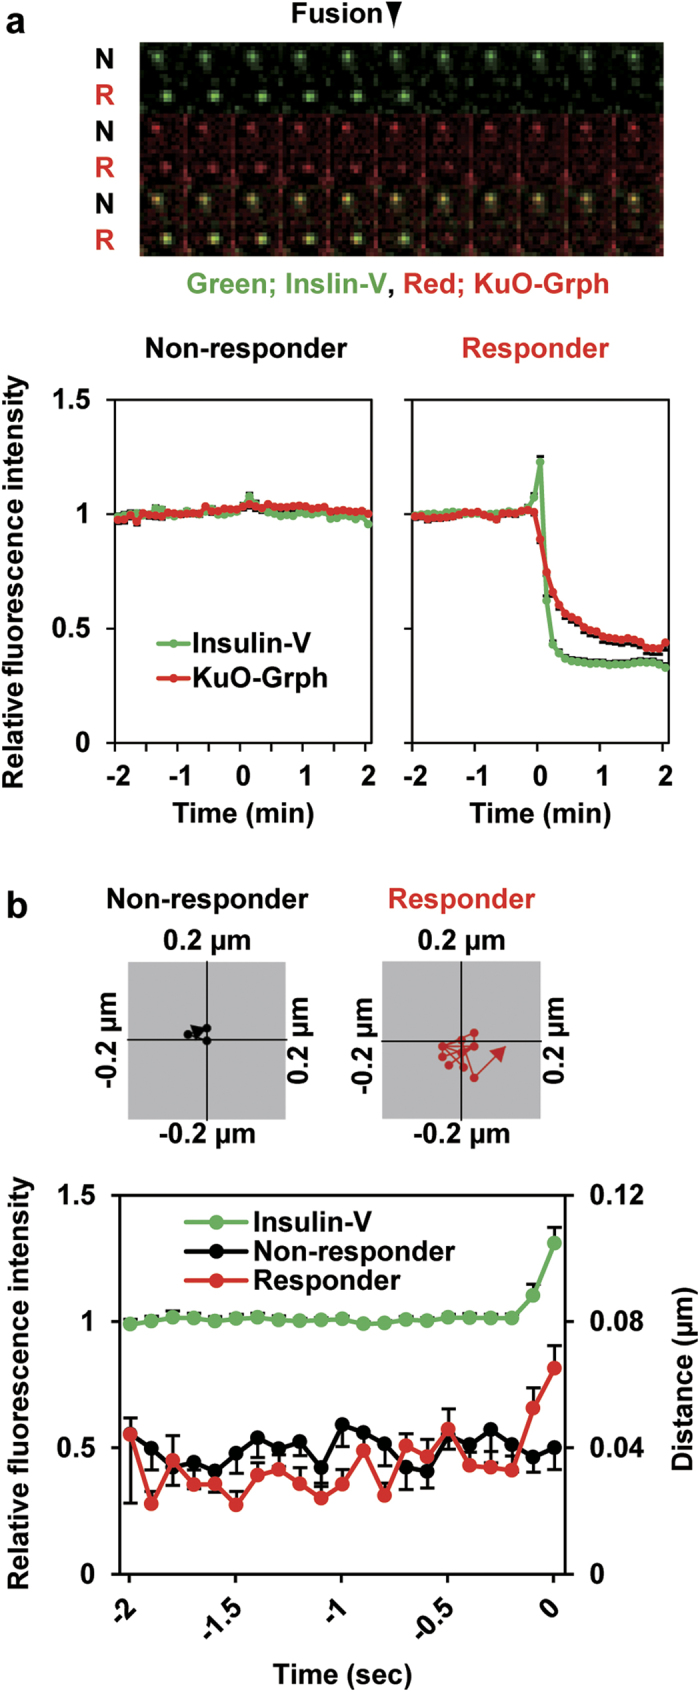
Figure 4. Docked granules release granuphilin and become mobile upon fusion.

The fluorescence profiles of insulin and granuphilin upon fusion (time zero) were monitored for granuphilin-positive residents in Grph-knockin cells. (a) Kymographs (top) show the fluorescence profiles of Insulin-V (green) and KuO-Grph (red) of fused granules (responder, R) and neighboring inert granules (non-responder, N). Bottom panels show normalized changes in fluorescence intensities of non-responders (n = 44 from 12 cells) and responders (n = 147 from 14 cells). (b) Upper panels show centroid plots of a representative granule track from a non-responder and a responder. Bottom panel plots distance of fluorescence center points of individual responders (red, n = 36) and non-responders (black, n = 20) between time points, as well as relative fluorescence intensity of Insulin-V in responders (green, n = 40), from 5 cells.
