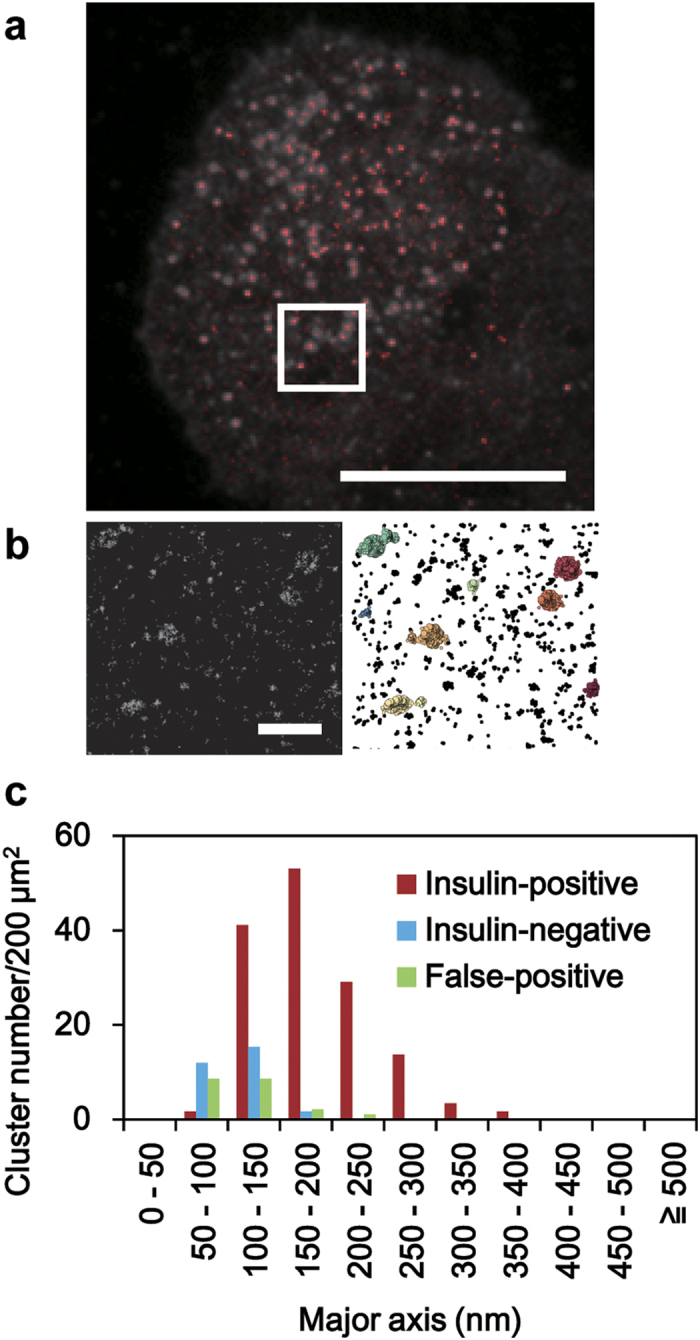
Figure 5. Granuphilin forms a 180-nm cluster on each docked granule.

MIN6 cells were immunostained with anti-granuphilin and anti-insulin antibodies. (a) A merged image of endogenous insulin (gray) by TIRFM and endogenous granuphilin (red) by dSTORM. Bar, 5 μm. (b) A dSTORM image of granuphilin ((b), left) and its clusters identified by DBSCAN ((b), right) from a boxed region in (a). Bar, 500 nm. (c) Histograms show the distribution of the major axis of granuphilin clusters. Granuphilin clusters identified in MIN6 cells are divided into two classes based on their location, either on (red) or not on (blue) insulin granules. The distribution of false-positive granuphilin clusters identified in corresponding areas of granuphilin-null β cells (green) is also shown.
