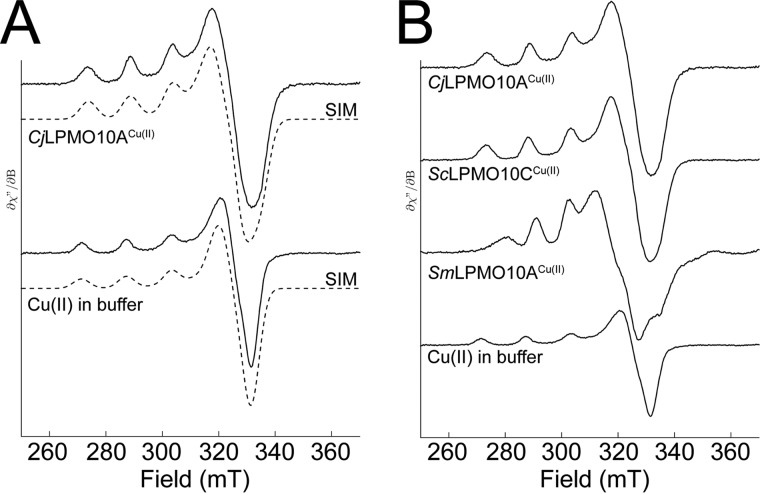
FIGURE 5.
Electron paramagnetic resonance spectroscopy of Cu(II)-saturated CjLPMO10Acd. A, X-band EPR spectra (—) with simulation (- - -) for Cu(II)-saturated CjLPMO10A (top) and Cu(II) in Pipes buffer, pH 6.5. B, comparison of EPR signals of CjLPMO10A, ScLPMO10C (cellulose-active), and SmLPMO10A (chitin-active). The EPR spectra were recorded at 30 K using a microwave power of 0.5 milliwatts.

