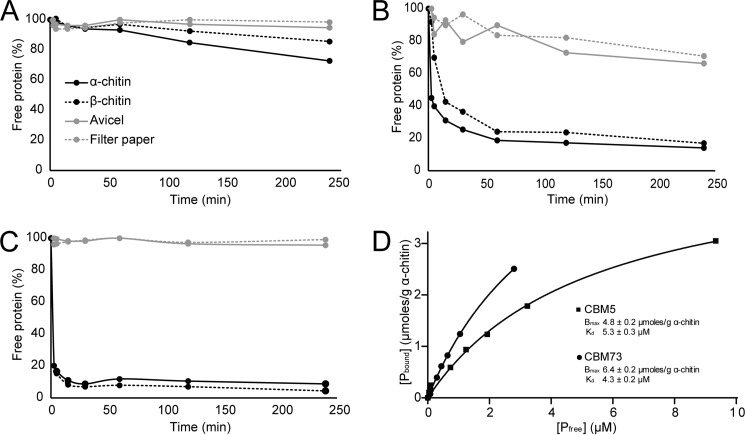
FIGURE 6.
Binding of the CjLPMO10A domains to chitin and cellulose. A–C show binding of the catalytic LPMO domain (A), the CBM5 domain (B), and the C-terminal domain (C) to chitin and cellulose substrates. The percentage of free protein was determined by measuring the reduction in protein concentration (A280) over time, in the absence of an electron donor. The experiments were carried out at 22 °C using 10 mg/ml substrate (α-chitin, β-chitin, Avicel, or filter paper) in 50 mm sodium phosphate buffer, pH 7.0. D, plots of binding data for the CBM5 (■) and the C-terminal (CBM73) domain (●) incubated with α-chitin. Pbound corresponds to bound protein (μmol/g substrate), and Pfree corresponds to non-bound protein (μm). Each point represents the average of values obtained in three independent experiments.

