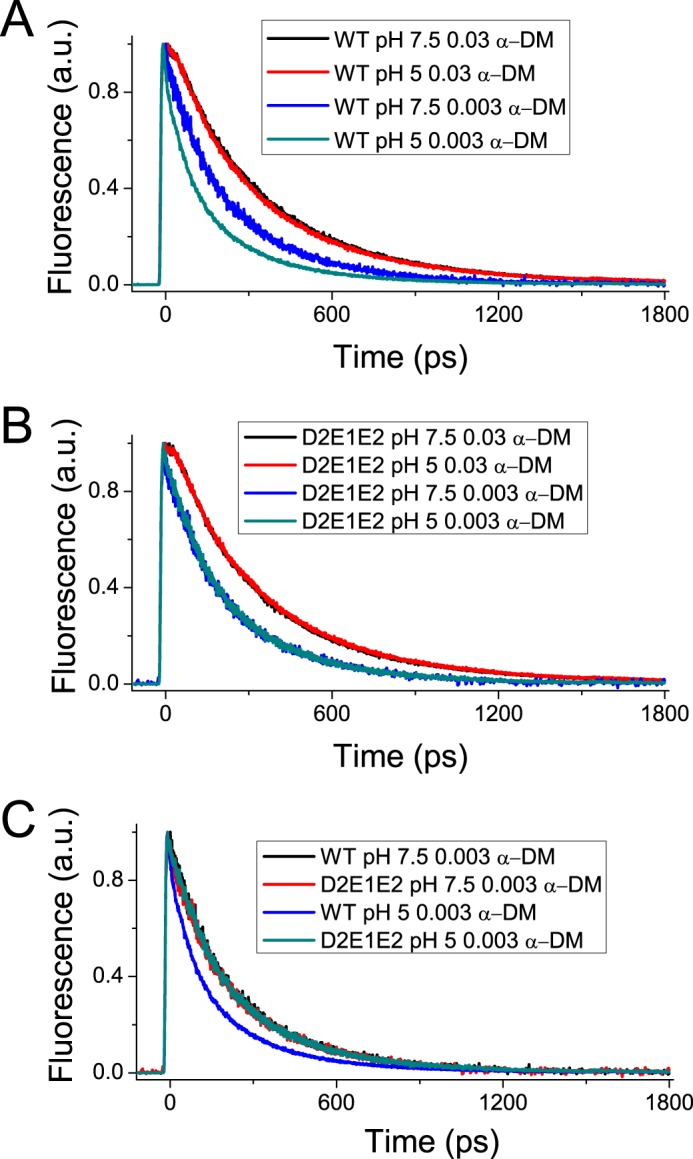
FIGURE 7.

Fluorescence decay kinetics. Fluorescence decay kinetics of recombinant LHCSR3 WT (panel A) and D2E1E2 mutant (panel B) at pH 7.5 or 5.0 in the presence of high (0.03%) or low (0.003%) detergent (α-DM) concentrations. The experiment was performed two times, each time with two independent biological replicates.
