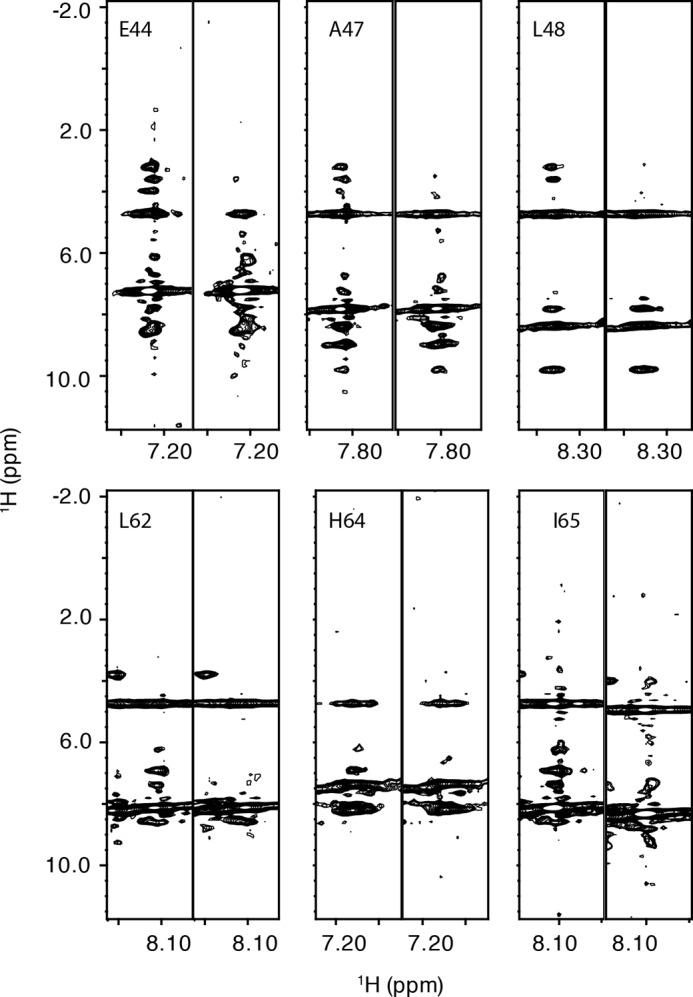
FIGURE 4.

Identification of the phenylalanine-binding site in RDPheH(25–117). Selected 15N slices of three-dimensional NOESY-HSQC spectra of RDPheH(25–117) are shown. For each pair of spectra, the left one is the spectrum of 1 mm 15N,2H-labeled RDPheH(25–117) with 5 mm phenylalanine, whereas the right one is the same region in the spectrum of 1 mm 15N,2H-labeled RDPheH(25–117) with 2H8− phenylalanine. Amide proton assignments are provided at the top of the left slice.
