FIGURE 3.

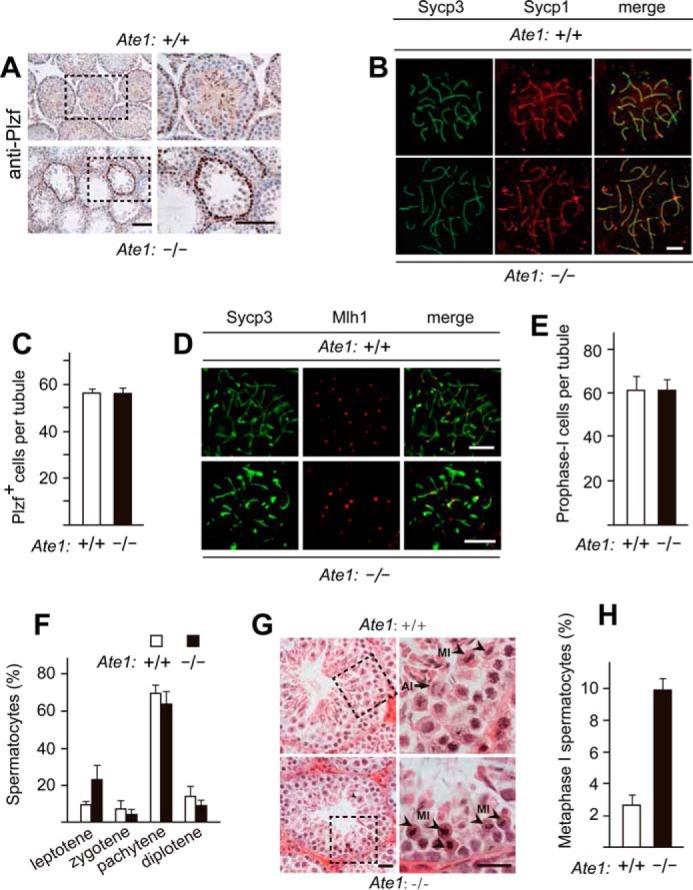
Knock-out of the Ate1 R-transferase gene does not affect the progression of spermatocytes through meiosis I until their arrest at metaphase. A, similar frequencies of cells (Plzf+ cells) that could be stained with antibody to Plzf, a spermatogonia-specific marker, in testes of Tnap-Ate1−/− versus wild-type males. Scale bars, 50 μm. B, Sycp3 (green) and Sycp1 (red) proteins, the markers for synaptonemal complex, detected (using corresponding antibodies) on chromosomes of Tnap-Ate1−/− versus wild-type spermatocytes at the pachytene stage of meiosis I. Scale bars, 5 μm. C, numbers of Plzf+ cells (presumptive spermatogonia) per section of a seminiferous tubule in Tnap-Ate1−/− versus wild-type males (quantification of results in A). D, same as in B but for Sycp3 and Mlh1 (the latter a marker for chromosome crossovers) in Tnap-Ate1−/− versus wild-type males. Scale bars, 5 μm. E, numbers of prophase I (Sycp3-positive) cells per section of a seminiferous tubule in Tnap-Ate1−/− versus wild-type males. F, percentages of spermatocytes at different prophase stages of meiosis I Tnap-Ate1−/− versus wild-type males. G, sections of Tnap-Ate1−/− versus wild-type testes were stained with hematoxylin/eosin. Subpanels on the right are enlargements of the areas demarcated by dashed rectangles on the left. An arrow and arrowheads indicate anaphase and metaphase cells, respectively. Scale bars, 50 μm. H, percentages of spermatocytes at metaphase I of meiosis I (quantification of cell images in G). S.D. values (error bars) are indicated in C, E, F, and H (the corresponding assays were carried out in triplicate).
