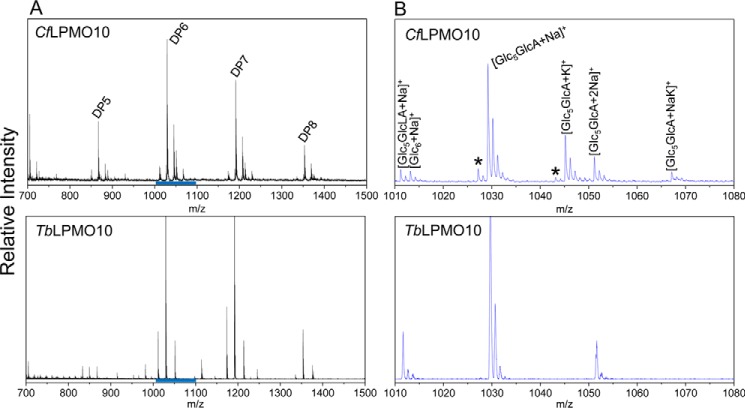
FIGURE 2.
MALDI-TOF analysis of products released by CtLPMO10 and TbLPMO10. A, the different oligosaccharides generated with DPs indicated. B, details of the cellohexaose species. GlcLA and GlcA represent the lactone and aldonic acid adducts, respectively. The blue bars in A correspond to the regions detailed in B. The asterisk indicates the peaks that are indicative of double C1+C4 oxidation, as they are 2 Da smaller than the corresponding C1-oxidized products.

