FIGURE 4.
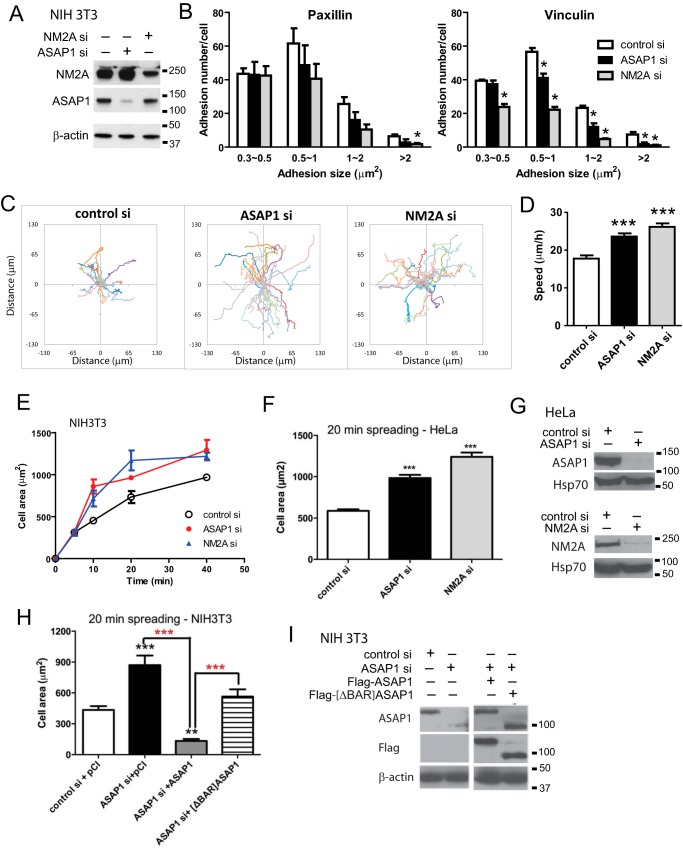
ASAP1 and NM2A have similar effects on cell adhesion, migration and spreading. A, efficiency of ASAP1 and NM2A knockdown in NIH3T3 fibroblasts was determined by immunoblotting. B, effect of ASAP1 and NM2A knockdown on FAs. siRNA-treated NIH3T3 fibroblasts plated on FN-coated coverslips were fixed and stained with anti-paxillin or vinculin antibody. The number and size of adhesions are the mean ± S.E. of three experiments. *, p < 0.05. C and D, effect of ASAP1 and NM2A knockdown on two-dimensional random migration. siRNA-treated NIH3T3 fibroblasts in FN-coated chambers were imaged using time-lapse phase contrast microscopy. Tracks of cells (C) and average migration speed (D) of 38 control si, 58 ASAP1 si, and 45 NM2A si-transfected cells are shown. ***, p < 0.0001. E, effect of ASAP1 and NM2A knockdown on cell spreading. NIH3T3 fibroblasts treated with siRNA were plated on FN for the times indicated. The area of rhodamine-phalloidin stained cells was determined for at least 30 cells per condition. Results shown are the combined mean ± S.E. from two experiments. F, effect of ASAP1 and NM2A knockdown on spreading of HeLa cells in 20 min was determined as described for NIH3T3 fibroblasts. Data are the mean ± range for two experiments. G, efficiency of ASAP1 and NM2A knockdown in HeLa cells determined by immunoblotting. Hsp70 was used as a loading control. H, effect of replacing endogenous ASAP1 with Flag-ASAP1 and Flag-[ΔBAR]ASAP1 on spreading of NIH 3T3 fibroblasts. NIH 3T3 fibroblasts, treated with siRNA and expressing pCI vector, Flag-tagged wild type ASAP1 or [ΔBAR]ASAP1, were plated on FN for 20 min. The results are from one experiment representative of three. I, efficiency of ASAP1 knockdown and relative expression of Flag-ASAP1 and Flag-[ΔBAR]ASAP1 determined by immunoblotting. Actin was used as a loading control. The recombinant ASAP1 were expressed to a level ∼100-fold that of the endogenous protein determined by titrating cell lysates (not shown). ***, p < 0.001 compared with control; **, p < 0.01 compared with control. In panel H, the red stars are p < 0.001 for the indicated comparisons.

