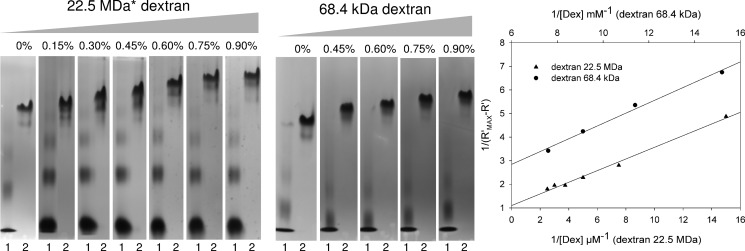
FIGURE 2.
Affinity gel electrophoresis of ΔN123-GBD-CD2 in gels containing variable amounts of dextrans. Left panel, affinity gels for which the content in dextran is expressed in % (w/v). Lanes 1 correspond to BSA, lanes 2 correspond to ΔN123-GBD-CD2. Right panel, double-reciprocal plots of the inverse of the relative electrophoretic mobility versus the inverse of dextran concentrations. The relative mobility was determined from the migration distances observed on the gels. * estimated average molecular weight.

