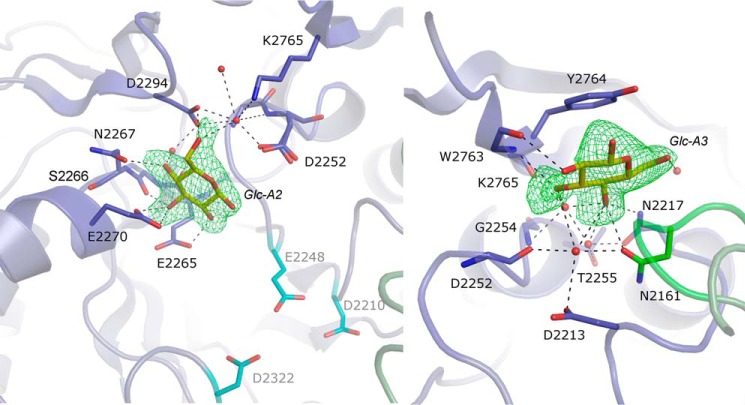
FIGURE 5.
Glucose-binding sites A2 (left panel) and A3 (right panel). The simulated annealing omit (Fo − Fc) electron density maps around glucose were contoured at 3σ or 2.3σ for A2 and A3, respectively. Interacting water molecules are depicted as red spheres. Residues of domains A or B are represented as blue or green sticks, respectively. For residues that are involved in sugar binding through their backbone atoms, side chains are omitted. In the left panel, residues forming the catalytic triad (Asp-2210, Glu-2248, and Asp-2322) are shown as turquoise sticks.

