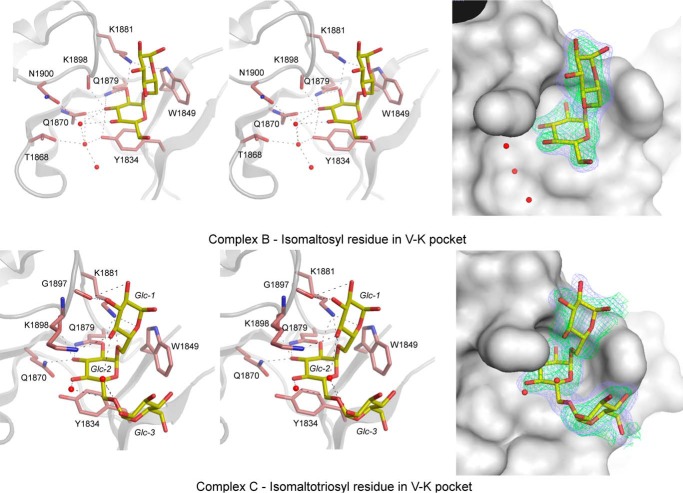
FIGURE 6.
Binding pocket V-K found in the GBD of ΔN123-GBD-CD2 in complexes B (upper panels) and C (lower panels). For this pocket, in complexes B or C, an isomaltosyl or isomaltotriosyl residue was observed and shown as yellow sticks. The network of hydrogen bonding is shown on the right panels, whereas the electron density map around carbohydrates is displayed on left panels. The residues and water molecules involved in binding are represented as pale red sticks and red spheres, respectively (right panels). The simulated annealing omit (Fo − Fc) electron density maps (in green) around carbohydrates were contoured at 3σ or 2σ for isomaltosyl and isomaltotriosyl, respectively. The σA weighted 2Fo − Fc electron density maps in blue were contoured at 0.9 σ.

