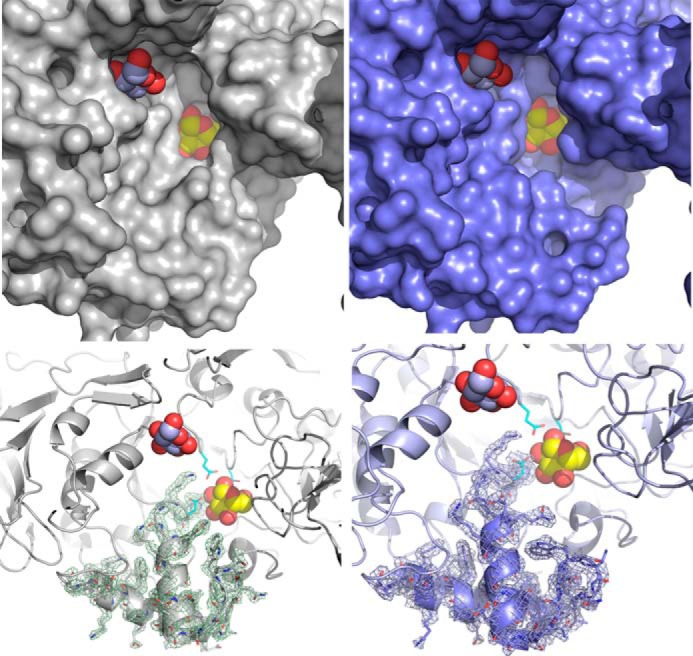
FIGURE 8.

Loop rearrangement in the catalytic gorge of ΔN123-GBD-CD2. The left panels show the catalytic gorge conformation in the apo form. The right panels show the same region for the structure of the complex B. The upper panels represent the protein surface, whereas the schematic representation has been used in the lower panels. The σA weighted 2Fo − Fc electron density maps around loop 7 of domain A were contoured at 1σ. To figure the active site, the d-glucose molecule bound in subsite −1, as found in the structure of the complex with glucose, is superimposed and represented as yellow and red spheres. The d-glucose molecule found in the binding site A2 is also represented (light blue and red spheres). Residues forming the catalytic triad are represented as turquoise sticks.
