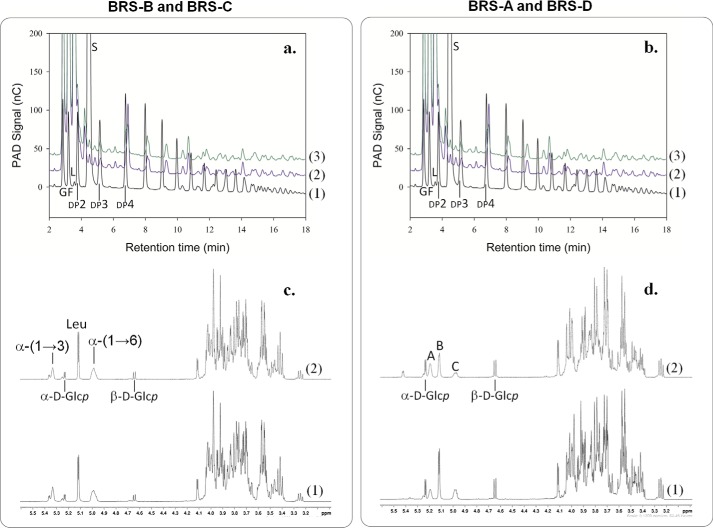
FIGURE 9.
Analysis of the products synthesized using BRS-C and BRS-D enzymes from sucrose (292 mm) and dextran 1500 g·mol−1 (66.6 mm). a, comparison of BRS-B and BRS-C HPAEC-PAD chromatograms. (1) Enzymatic reaction at the initial time (t = 0 min), (2) enzymatic reaction using BRS-B stopped after 8 h, and (3) enzymatic reaction using BRS-C stopped after 8 h. nC, nanocoulombs. b, comparison of BRS-A and BRS-D HPAEC-PAD chromatograms. (1) Enzymatic reaction at the initial time (t = 0 min), (2) enzymatic reaction using BRS-B stopped after 8 h, and (3) enzymatic reaction using BRS-C stopped after 8 h. G, peak corresponding to glucose fructose (F), leucrose (L), sucrose (S), and isomaltooligosaccharides with a degree of polymerization (DP) of x. c, 1H NMR spectrum of the products synthesized by BRS-B (1) and BRS-C (2) at 500 MHz in D2O leucrose (Leu), α-d-glucose (α-d-Glcp), β-d-glucose (β-d-Glcp), α-(1→6)-linked glucosyl residues (α-(1→6)), and α-(1→3)-linked glucosyl residues (α-(1→3)). d, 1H NMR spectrum of the products synthesized by BRS-A (1) and BRS-D (2) at 500 MHz in D2O. The 1H NMR spectra of the BRS-A modified dextran displayed all the chemical shift characteristics of α-(1→2)-branched dextran. The anomeric region of the spectrum contained three main resonances corresponding, respectively, to anomeric resonance of α-(1→6)-linked d-Glcp residues of the main linear chain with free carbon 2 (4.98 ppm, peak C), to anomeric resonance from α-(1→6)-linked d-Glcp residues of the main linear chain, with the carbon 2 involved in an α-(1→2) linkage with a branched glucosyl unit (5.18 ppm, peak A), to anomeric resonance from α-(1→2)-linked d-Glcp (5.11 ppm, branching points, peak B).

