
FIGURE 3.
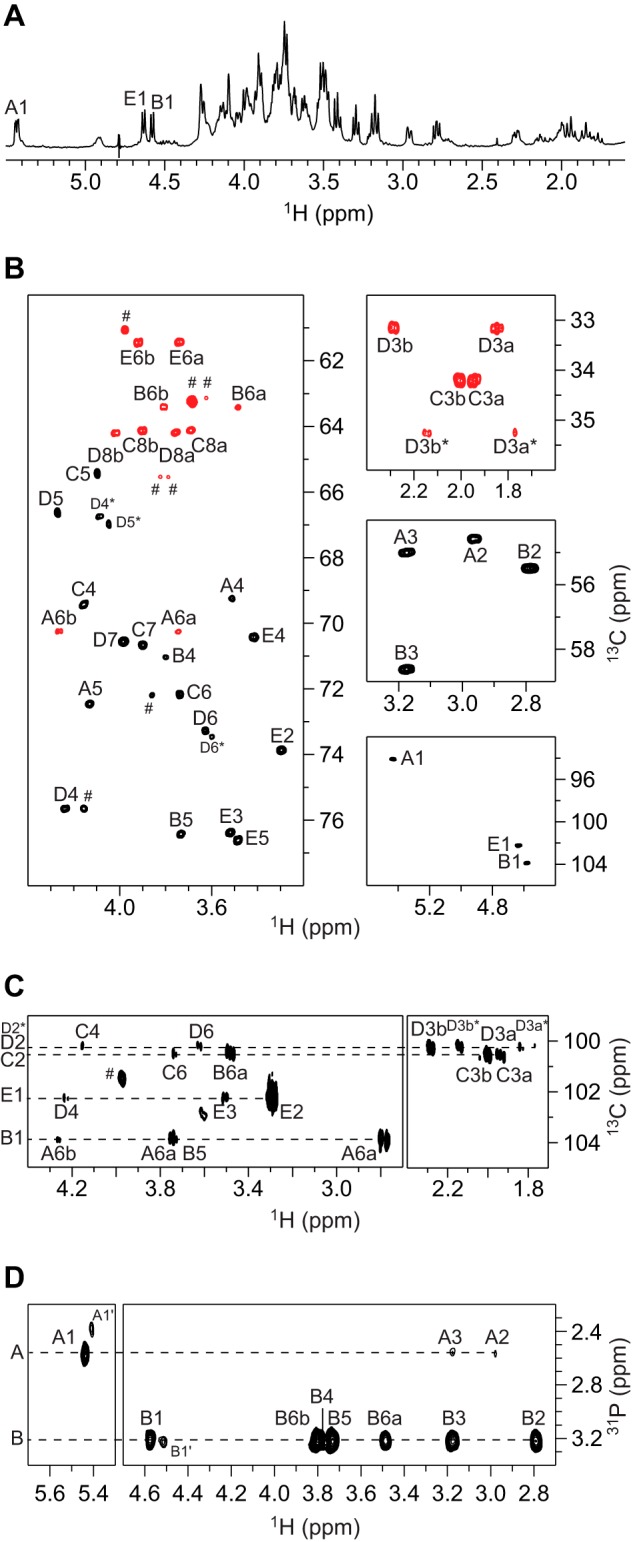
NMR spectra of the deacylated LOS from Bm_manBcore. A, selected region of the diffusion-filtered 1H NMR spectrum. B, selected regions of the multiplicity-edited 1H,13C HSQC spectrum showing the anomeric region (right bottom), the region for the nitrogen-bearing carbons (right middle), the region for the 3-deoxy-groups of the Kdo residues (right top), and the region for the ring atoms and those from hydroxymethyl groups (left) in which the cross-peaks from the latter appear in red. C, selected region of the 1H,13C HMBC spectrum showing intra- and inter-residue correlations from anomeric carbons. D, selected region of the 1H,31P-hetero TOCSY spectrum (τm = 92 ms) showing correlations from the phosphate groups in residues A and B. Signals from impurities of lower molecular mass than the LOS oligosaccharides of B. melitensis are indicated by the hash symbol.