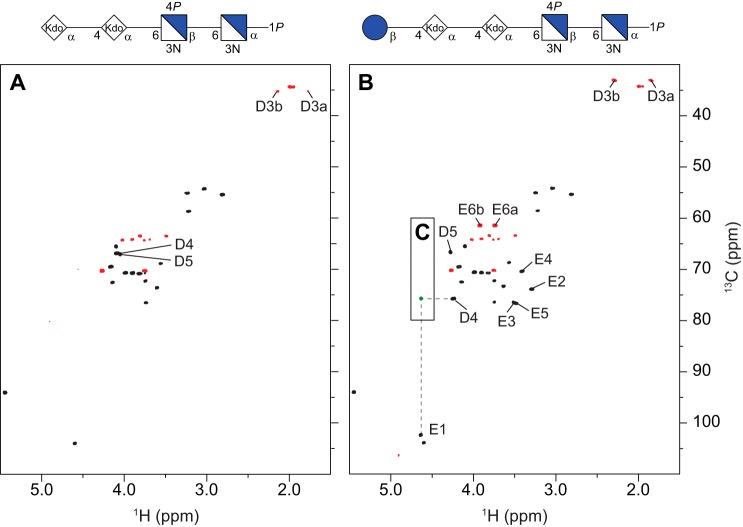
FIGURE 6.
NMR spectra of the deacylated LOS from Bm_wadC_per. Comparison of the multiplicity-edited 1H,13C HSQC spectra (black/red) of the tetrasaccharide (A) and pentasaccharide (B) (OS1 and OS2, respectively) isolated from Bm_wadC_per; the cross-peaks with significant chemical shift differences between the two oligosaccharides are annotated. The structures (in CFG format) of the respective oligosaccharides are shown on the top of each spectra. C, overlay of a selected region of the 1H,13C HMBC spectrum of the OS2 showing an interglycosidic heteronuclear long range correlation (green) between residues D and E.

