
FIGURE 4.
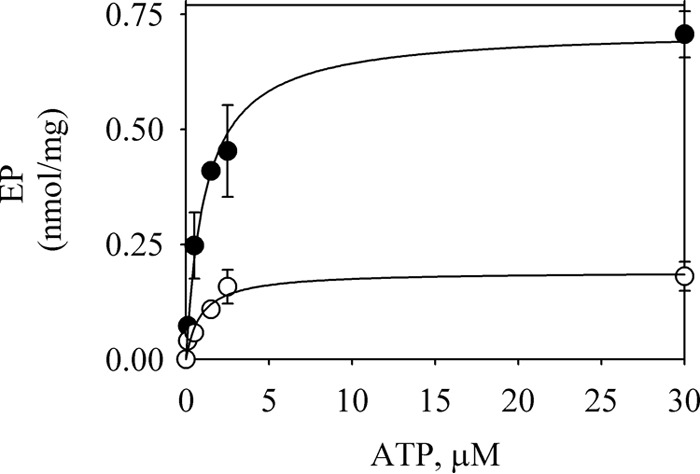
ATP dependence of EP formation. 1.5 μg of GFP-Spf1p was suspended at 4 °C in a medium containing 2 mm Mg2+, 0.5 mm EGTA, and the phosphorylation was started by adding ATP (filled circles) or ATP plus CaCl2 to give 100 μm Ca2+ (empty circles). The reaction time was 5 s. The concentrations of ATP indicated correspond to the final concentration in the reaction medium. The data points are the averages from two experiments, and the error bars show the standard deviation. The lines represent the best fit to the data given by a hyperbolic equation with EP = EPmax5 [ATP]/(Km + [Ca2+]) with the following parameters: without Ca2+, EPmax5 = 0.72 ± 0.03 nmol/mg, Km = 1.1 ± 0.1 μm, with Ca2+, EPmax5 = 0.19 ± 0.01 nmol/mg, and Km = 0.9 ± 0.3 μm.