
Figure 8. Isobologram showing the anti-hyperalgesic interaction of vitexin (ED50 = 1.95 mg/kg) and acetaminophen (ED50 = 68.27 mg/kg) in the mouse model of incisional pain.
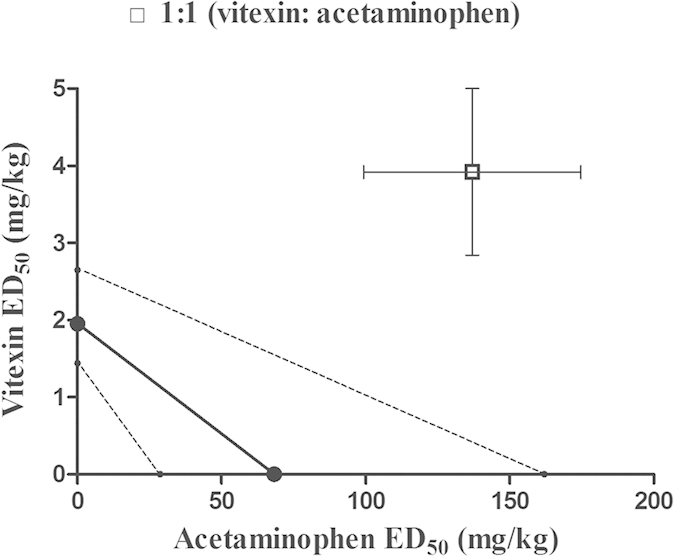
Abscissa scale: ED50 value of acetaminophen; Ordinate scale: ED50 value of vitexin (n = 10 per group). Horizontal and vertical bars indicate SEM. The oblique line between the x- and y-axes is the theoretical line of additivity. The dashed thin lines are the global 95% confidence boundaries, indicating the limits of the additive line. The point that represents ED50 values (±SEM) of the drug mixture fell far above the limits of the additive line, suggesting a significant infra-additive interaction.