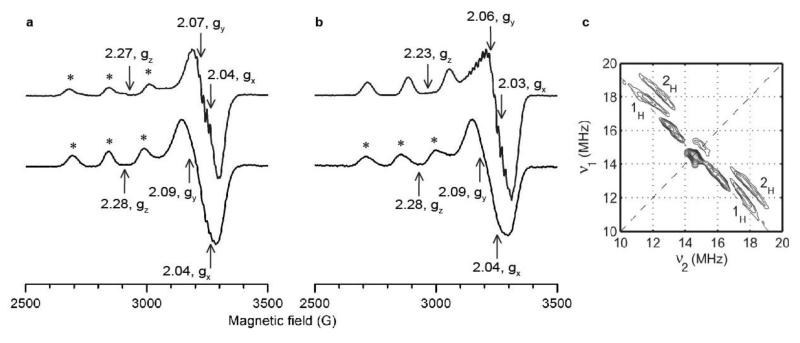
Figure 5. EPR spectra of Ls(AA9)A at 150 K.
* indicates signals from copper site where water was the exogenous ligand, other signals were from species with chloride as exogenous ligand. a, X-band cw EPR spectra in low chloride conditions, Ls(AA9)A-G6 (top) and Ls(AA9)A with no oligosaccharide (bottom). b, X-band cw EPR spectra in high chloride conditions, Ls(AA9)A-G6 (top) and Ls(AA9)A with no oligosaccharide (bottom). c, Contour presentation of the 1H-HYSCORE spectrum of Ls(AA9)A-G6 in the presence of chloride ions (magnetic field 343.6 mT, time between first and second pulse τ = 136 ns, microwave frequency 9.7 GHz). The anti-diagonal cross-peaks are assigned to anisotropic protons, labelled 1H and 2H.

