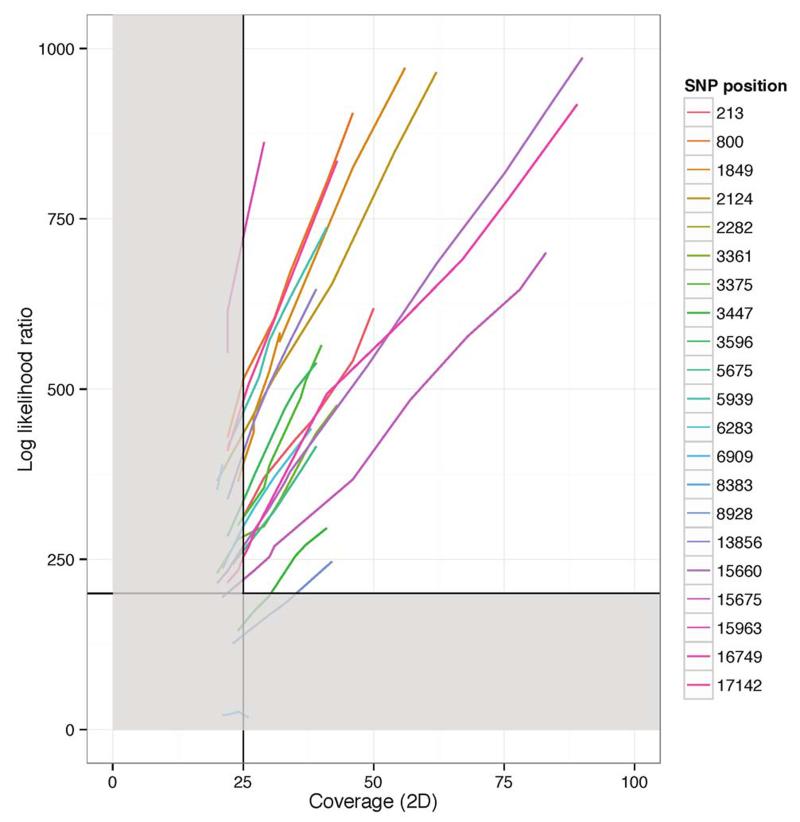
Extended Figure 5. Relationship between coverage and log-likelihood ratio for sample 076769.
Line-plot showing the relationship between sequence depth of coverage (x axis) and the log-likelihood ratio for detected SNPs derived by subsampling reads from a single sequencing run to simulate the effect of low coverage. The horizontal and vertical line indicates the cut-offs (quality and coverage respectively) for consensus calling. Therefore, all variants are detected below 25x coverage, and the vast majority meet the threshold quality at 25x coverage or slightly above. Any combination of log likelihood ratio or coverage which placed variants in the grey box would be represented as a masked position in the final consensus sequence.

