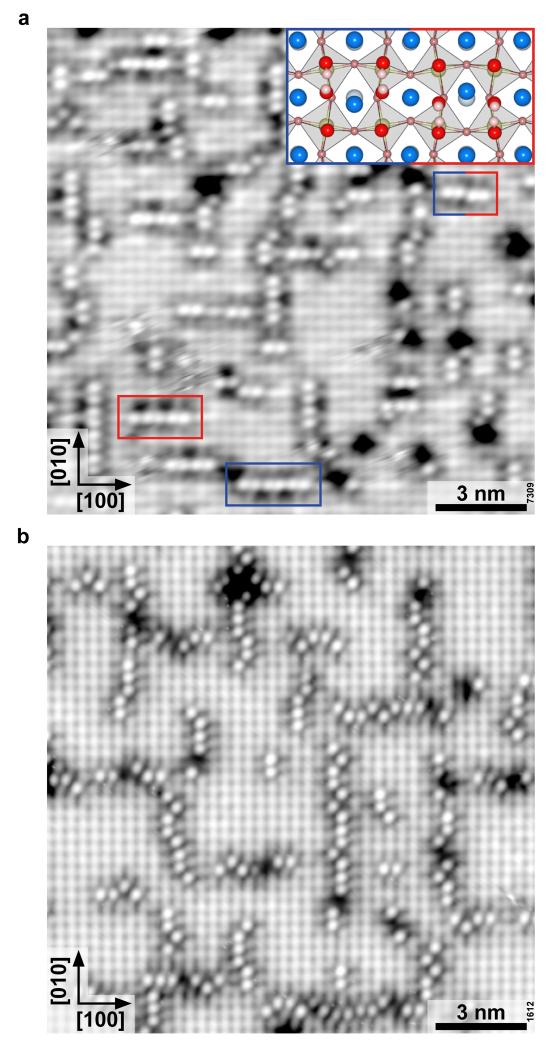
Figure 3. Formation of H2O chains.
STM images after annealing to room temperature a H2O dose of 0.05 Langmuir for 1 hour. a) Sr3Ru2O7 (T = 78 K, Vsample = +0.5 V, Itunnel = 0.15 nA, image rotated 20° counterclockwise to scan direction). Dimers within the chains are slightly shifted upwards (blue rectangle) and downwards (red rectangle) from the Sr-Sr bridge sites. The inset shows the adsorption geometry of two dimers sitting next to each other, where the OsurfH fragments of the left and right dimers sit above and below a row of Sr atoms, respectively. b) Sr2RuO4 (T = 78 K, Vsample = +0.7 V, Itunnel = 0.15 nA, image rotated 36.5° clockwise to scan direction).

