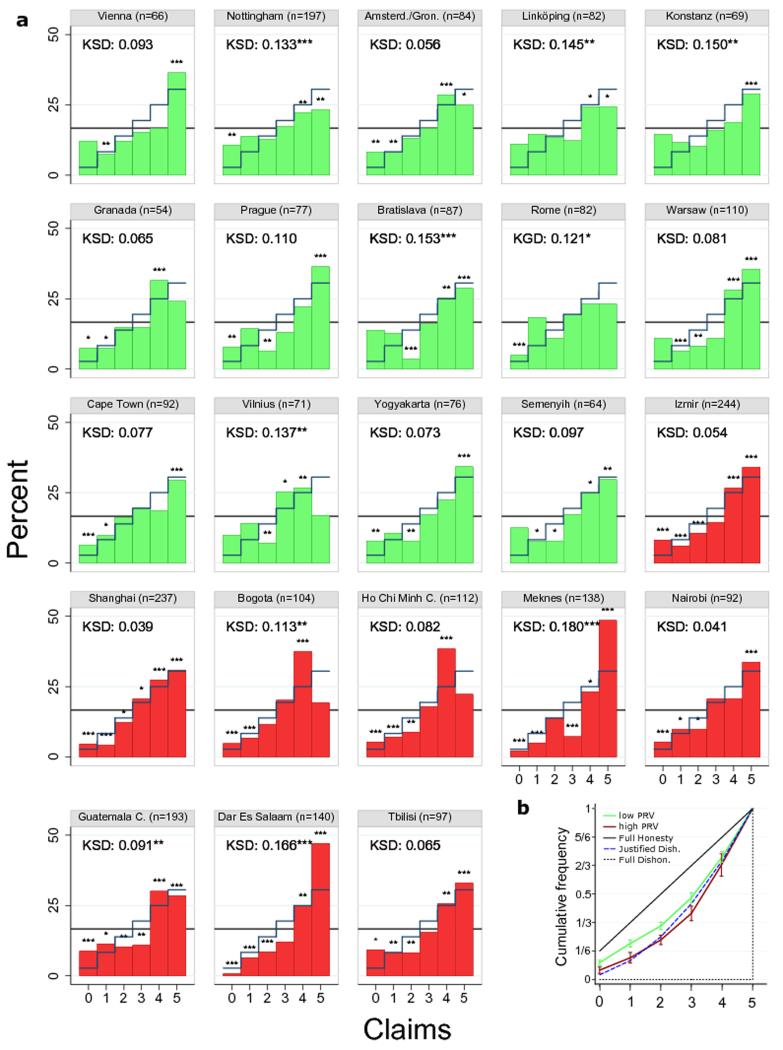
Extended Data Figure 2. Distribution of claims.
a. Distribution per subject pool. Subject pools are ordered by country PRV. The first 14 subject pools (in green) are from “low” (below-average) PRV countries; the last 9 subject pools (in red) are from “high” (above-average) PRV countries relative to the world sample of 159 countries. The horizontal black line refers to the uniform distribution implied by honest reporting and the blue step function to the distribution implied by the Justified Dishonesty benchmark (JDB). For each subject pool we report the one-sample Kolmogorov-Smirnov test (KS) for discrete data in comparison with JDB (KSD is the KS d value). Stars above bars refer to binomial tests comparing the frequency of a particular claim with its predicted value under a uniform distribution. b. Cumulative distributions for pooled data from subject pools from low and high PRV countries, respectively. See Supplementary Analysis for further information. * P < 0.1, ** P < 0.05, *** P < 0.01.

