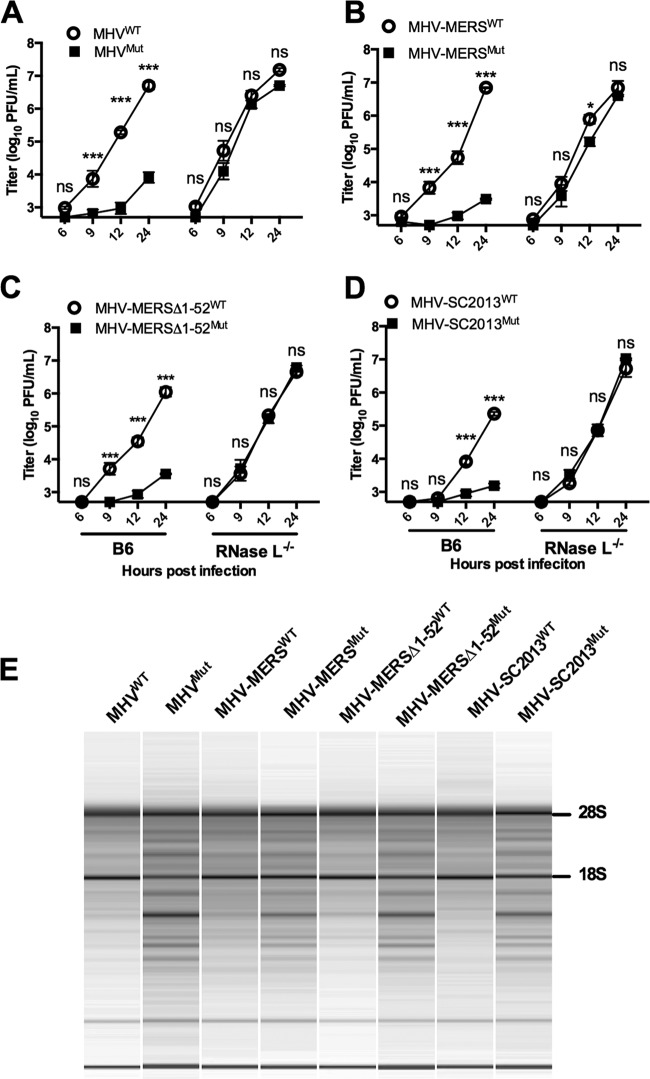
FIG 6 .
Lineage C PDE NS4b proteins functionally replace MHV NS2 in primary BMM. (A to D) Representative one-step growth curve of WT and mutant (Mut) MHV (A) and chimeric viruses expressing WT and mutant NS4b proteins (diagrammed in Fig. 4B), WT and mutant MHV-MERS (B), WT and mutant MHV-MERSΔ1-52 (C), and WT and mutant MHV-SC2013 (D) in B6 and RNase L−/− BMM (MOI of 1 PFU; n = 3). Statistical significance was determined by two-way analysis of variance (ANOVA) with Sidak’s multiple comparisons and is indicated as follows: *, P value of <0.05; **, P < 0.01; ***, P < 0.001. Values that are not significantly different (ns) are indicated. Values are means ± SEM (error bars). These data are from one representative experiment of three experiments. (E) rRNA degradation pattern 15 h postinfection in B6 BMM. Data are from one representative experiment of three (MOI of 1 PFU; n = 3). The positions of 28S and 18S rRNAs are shown to the right of the gel.

