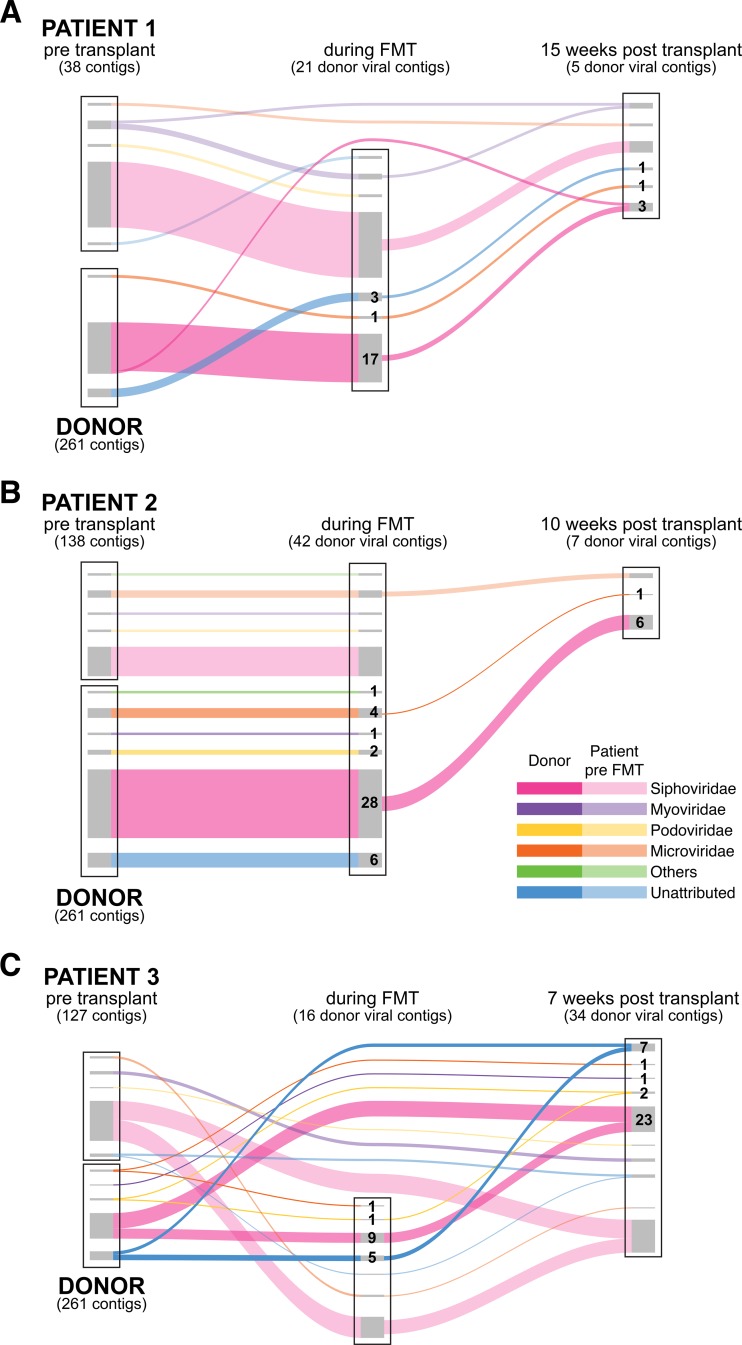
FIG 2 .
Transfer of phage between human individuals. Transmission is shown using Sankey diagrams. Data from patients 1 to 3 are shown from top to bottom. For each subject, contigs of >3,000 bp are shown as the box at the left, with recipient contigs on top and donor contigs below. In the middle, contigs detected at the FMT time point are shown; to the right are contigs detected after cessation of FMT (post). Curves with darker colors show the persistence of donor contigs and curves with lighter colors the persistence of recipient contigs. The color of each strand represents a single viral family. Numbers indicate the number of donor contigs transferred from each viral family.

