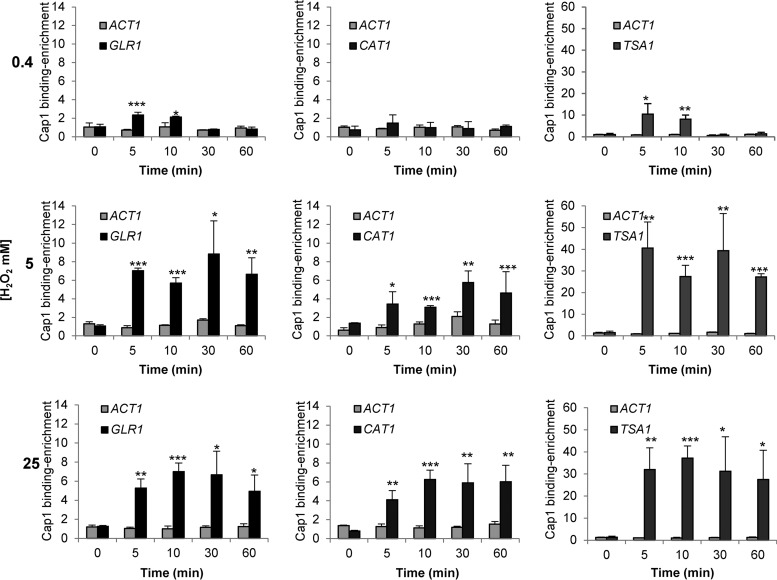
FIG 6 .
Quantification of Cap1 enrichment at the GLR1, CAT1, and TSA1 promoter targets. Cells expressing Cap1-MH (JC948) were treated with 0.4, 5, or 25 mM H2O2 for the indicated times and subjected to ChIP. The recovered DNA samples were analyzed by qPCR using primers specific for promoter regions within GLR1, CAT1, and TSA1. Relative Cap1-MH enrichment values (n-fold) are presented (mean ± SD; n = 3). The following P values were considered: *, P ≤ 0.05; **, P ≤ 0.01; and ***, P ≤ 0.001.

