FIG 2 .
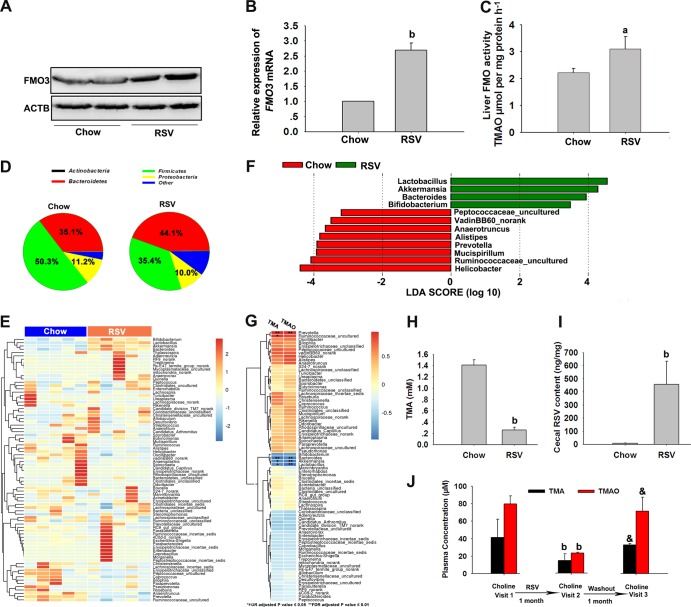
RSV inhibited TMAO synthesis by decreasing TMA generation via remodeling microbiota in C57BL/6J mice. Eight-week-old female C57BL/6J mice (n = 5 per group) were fed chow with or without RSV (0.4%) for 30 days. ACTB, β-actin. (A) Western blotting detection of FMO3 in the liver. (B) Expression levels of FMO3 gene mRNAs were quantified using qPCR assays. (C) Liver FMO activity was assessed as described in Materials and Methods. (D) 16S rRNA gene sequencing analysis of cecal content at the phylum level. (E) Heat map of 16S rRNA gene sequencing analysis of cecal content at the genus level. The scale reflects the data as follows: red indicates high values whereas blue indicates low values for the percentages of reads that were classified at that rank. (F) Linear discriminant analysis (LDA) coupled with effect size measurements identifies the taxons most differentially abundant between the chow and RSV diets at the genus level. RSV-diet-enriched taxa are indicated with a positive LDA score (green), and taxa enriched in the normal chow diet have a negative score (red). Only taxa meeting an LDA significant threshold value of >2 are shown. (G) Correlation heat map demonstrating the association between the indicated microbiota taxonomic genera and TMA and TMAO concentrations (all reported as means ± SD in micromoles) from mice grouped by dietary status (chow and RSV). Red denotes a positive association, blue a negative association, and white no association. A single asterisk indicates a significant FDR-adjusted association at P values of ≤0.05, and a double asterisk indicates a significant FDR-adjusted association at P values of ≤0.01. (H) The production of TMA from choline by cecal content in vitro. (I) Cecal RSV content. (J) The same 8-week-old female C57BL/6J mice (n = 5 per group) were administered choline (400 mg/kg) at visit 1 (baseline), visit 2 (RSV treatment for 1 month), and visit 3 (washout for 1 month). Four hours after choline was given at each visit, blood samples were obtained from the tail veins. Serum TMA and TMAO levels were determined by LC/MS. Values are presented as means ± SD (n = 5). a, P < 0.05; b, P < 0.01 (versus vehicle-treated control group); &, P < 0.01 (versus RSV-treated group).

