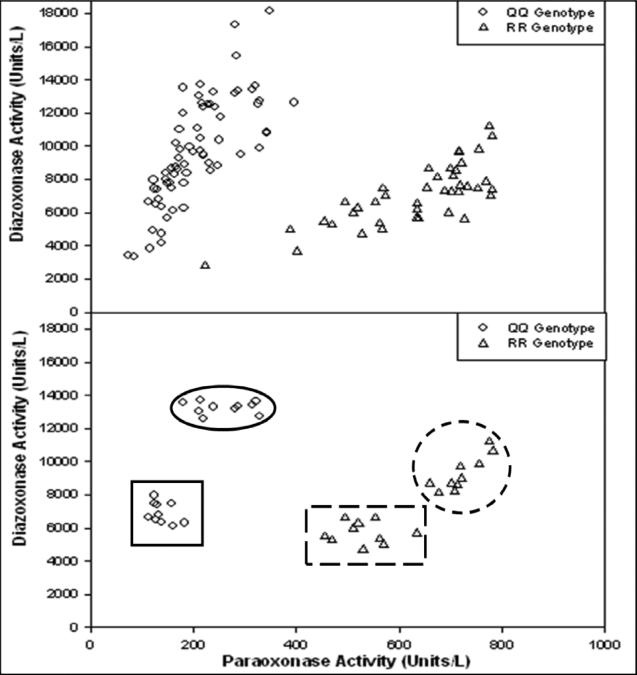
FIGURE 1.
Plot of diazoxonase activities versus paraoxonase activities in the presence of 2M NaCl of human sera showing the separation of homozygous QQ (◇) from homozygous RR (Δ) in the original study sample (top) and the groups selected for the study as high QQ (solid oval outline), low QQ (solid square outline), high RR (dashed circle outline), and low RR (dashed rectangular outline) (bottom). Data derived from Coombes et al. (2011).

