
Figure 1.
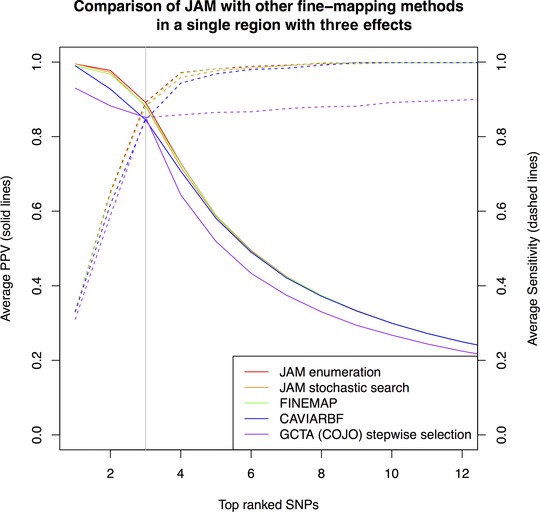
Comparison of ranking performance by JAM against other fine‐mapping strategies for 15,356 individuals (the total size of the MAGIC consortium). Ranking performance is measured in terms of PPV, the proportion of true signal SNPs in the selection (solid lines, left y‐axis) and power/sensitivity, the proportion of all simulated signals included (dashed lines, right y‐axis). For each method, the average PPV and sensitivity estimates consist of points for each SNP rank, which we have joined with lines to ease the visual comparison. Data were simulated for a single region of 41 SNPs, three of which were given effects as described in the main text. For LD estimation, JAM, FINEMAP, CAVIARBF and GCTA (COJO) were provided with an independently simulated reference dataset of 2,674, the size of the WTCCC control sample. Estimates are averaged over 200 simulation replicates. A vertical grey line highlights the rank equal to the number of true signals, where PPV and sensitivity by definition intersect. Performance of JAM's enumeration (red), JAM's stochastic search (orange) and FINEMAP (green) were indistinguishable and hence these lines are superimposed on top of one another. Performance of CAVIARBF (blue) was marginally weaker than JAM and FINEMAP for top‐ranked SNPs, but indistinguishable at lower ranks.