
Figure 2.
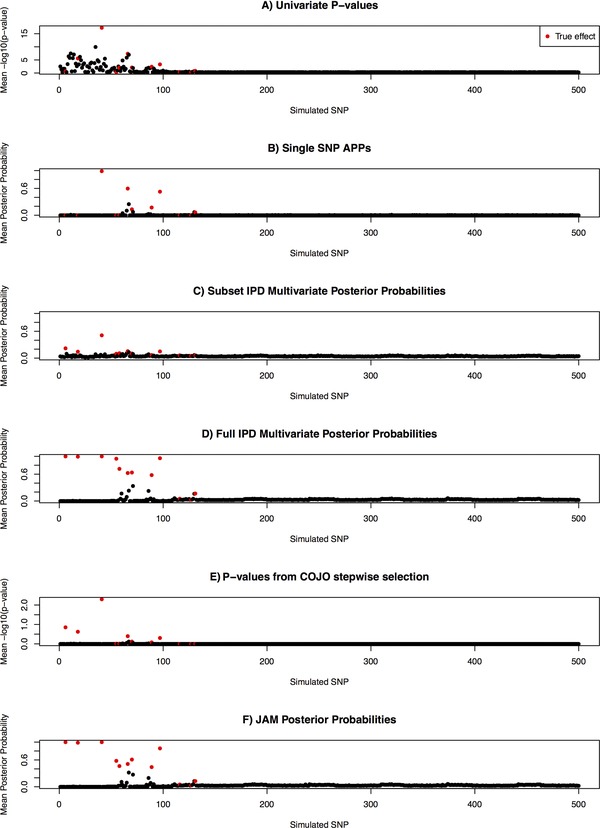
Comparison of signal to noise discrimination by JAM against various strategies when 12 effects were simulated among 10,000 SNPs for 15,356 individuals (the total size of the MAGIC consortium). Results are only displayed for the first 500 simulated SNPs, which included all 40 simulated effects. For LD estimation, JAM was provided with an independently simulated reference dataset of 2,674, the size of the WTCCC control sample. All summary statistics are averaged over 200 simulation replicates. The 12 true effects are highlighted in red. IPD: individual patient data; ABF: Wakefield's approximate Bayes factor.