
Figure 5.
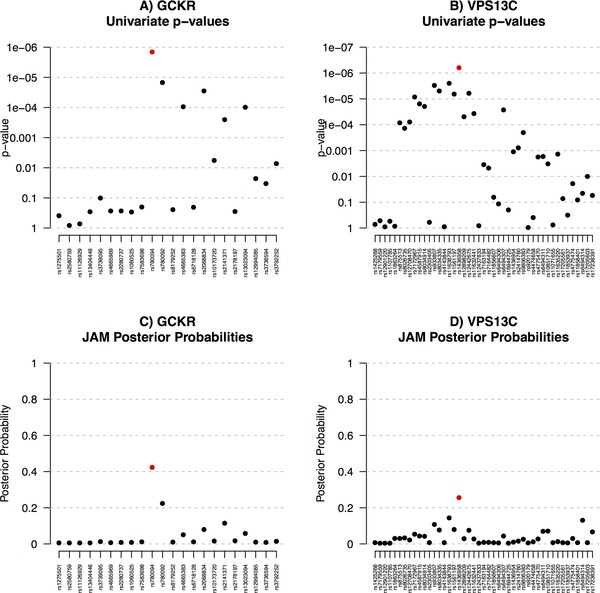
Application of JAM to marginal results reported by MAGIC for two of the top loci associated with 2‐hr fasting glucose, for which the MAGIC index SNP is represented by a tag. For GCKR, our tag SNP had D' 0.96 with the MAGIC index, and for VPS13C, our tag was in LD at D' 0.98. Both tags were the top SNPs. Panels (A) and (B) display marginal one‐at‐a‐time p‐values, (C) and (D) display multivariate adjusted posterior probabilities as inferred by JAM. For both genes JAM found no evidence for more than a single effect, although there was uncertainty around the location.