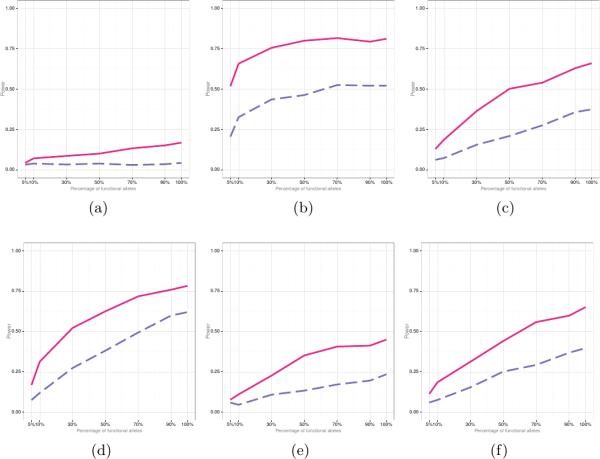
Figure 3.

Empirical power of FANOVA (solid line) and SKAT (dashed line) when the variants can have either protective or deleterious effects (i.e., μγ = μα = 0). Panel (a): N = 50 σγ = σα = 0.05; (b): N = 50 σγ = σα = 1; (c): N = 500 σγ = σα = 0.05; (d): N = 1000 σγ = σα = 0.05; (e) N = 2500 σγ = σα = 0.015; (f) N = 5000 σγ = σα = 0.015.
