Figure 3.
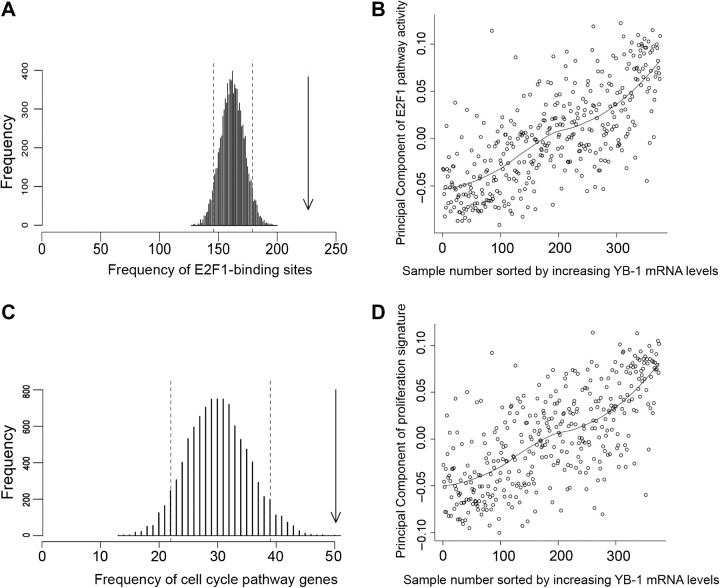
Association of Y-box binding factor 1 (YB-1) mRNA expression with E2F1 and proliferation pathways in tumors from non-adjuvant-treated breast cancer patients. A) Permutation analysis for E2F1 binding sites. Random lists of 439 probe sets were analyzed for the presence of V$E2F1_Q3_01 sites in their promoters, resulting in a Poisson distribution. Dotted lines represent the 5th and 95th percentiles. The arrow shows the abundance of V$E2F1_Q3_01 sites in the promoters of the 379 genes whose transcripts show greater than 98th percentile correlation (Spearman ρ > .591) with the YBX1 208627_s_at probe set (P ≤ 1 × 10⁻⁴). B) Principal Component analysis showing the activity of the E2F1 pathway (inferred from a Principal Component of the expression of known E2F1 transcriptional targets) plotted against increasing YB-1 mRNA expression (YBX1 208627_s_at levels). Each individual sample is shown as an open circle. A line of best fit has been drawn to show the trend. C) Permutation analysis showing enrichment of the Gene Ontology cell cycle pathway in 439 probe sets whose expression was positively correlated with YB-1 mRNA (YBX1 208627_s_at) expression. Analysis of the level of enrichment of the Gene Ontology cell cycle pathway in 10 000 random lists of 379 genes resulted in a Poisson distribution. Dotted lines represent 5th and 95th percentiles. The arrow indicates the enrichment of the Gene Ontology cell cycle pathway in the 439 probe sets that had a higher than 98th percentile–positive correlation with YB-1 mRNA (YBX1 208627_s_at) expression (P ≤ 1 × 10⁻⁴). D) Principal Component analysis showing a breast cancer proliferation signature (60) plotted against increasing levels of YB-1 mRNA (YBX1 208627_s_at) expression. Each individual tumor sample is shown as an open circle. A line of best fit has been drawn to show the trend. Correlation between YB-1 and the E2F1 pathway, and YB-1 and the breast cancer proliferation signature (Spearman ρ = .73 and.69, respectively) is much greater than correlation between the Principal Components of the E2F1 pathway and the breast cancer proliferation signature (Spearman ρ = .26; data not shown).

