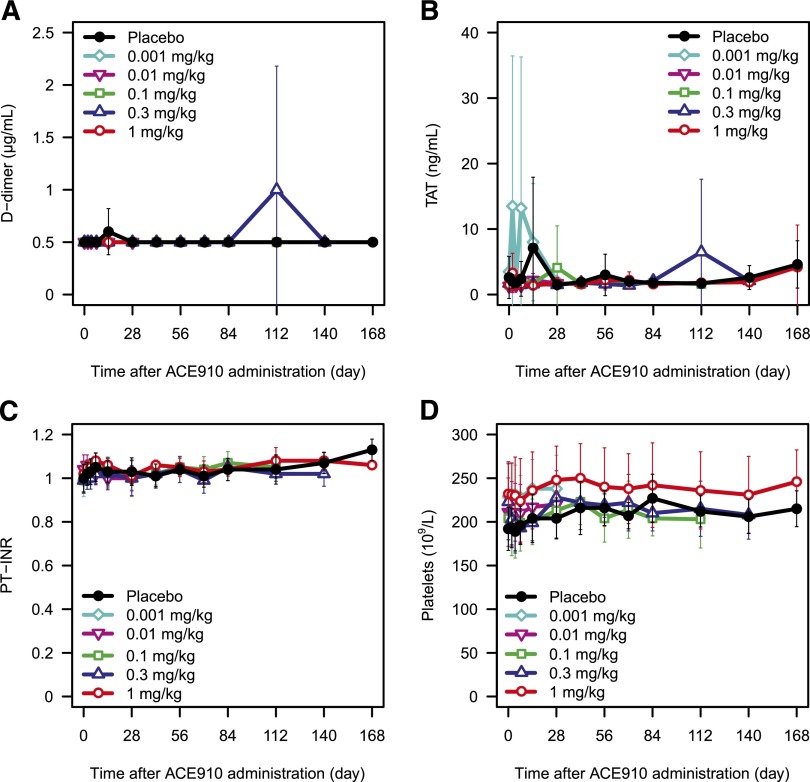
Figure 6.
Coagulation markers and platelet count after single subcutaneous injection of ACE910. The time courses of d-dimer (A), TAT (B), PT-INR (C), and platelet count (D) after single subcutaneous injection of placebo (black circle), 0.001 mg/kg (light blue diamond), 0.01 mg/kg (pink reverse triangle), 0.1 mg/kg (green square), 0.3 mg/kg (blue triangle), and 1 mg/kg (red circle) of ACE910 in Japanese healthy subjects are shown. Results are presented as mean ± standard deviation. The data out of the quantification range were imputed by the limit of quantification values.

