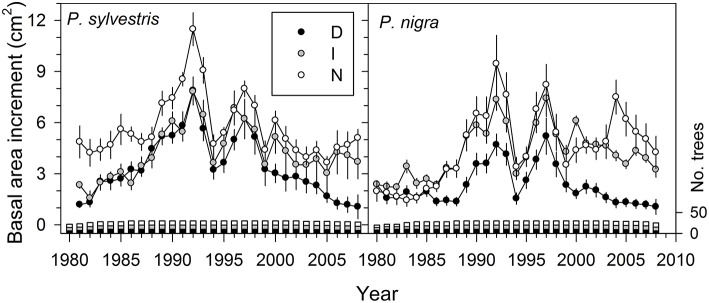
Figure 1.
Recent patterns in basal area increment of the two study pine species according to defoliation intensity (D, severe defoliation, black symbols; I, intermediate defoliation, gray symbols; N, scarce or no defoliation, empty symbols). Values are means ± SE (standard errors) and the bars show the annual number of measured trees (right y axis, sample depth) for each defoliation type (same colors are used for growth and sample depth data).

