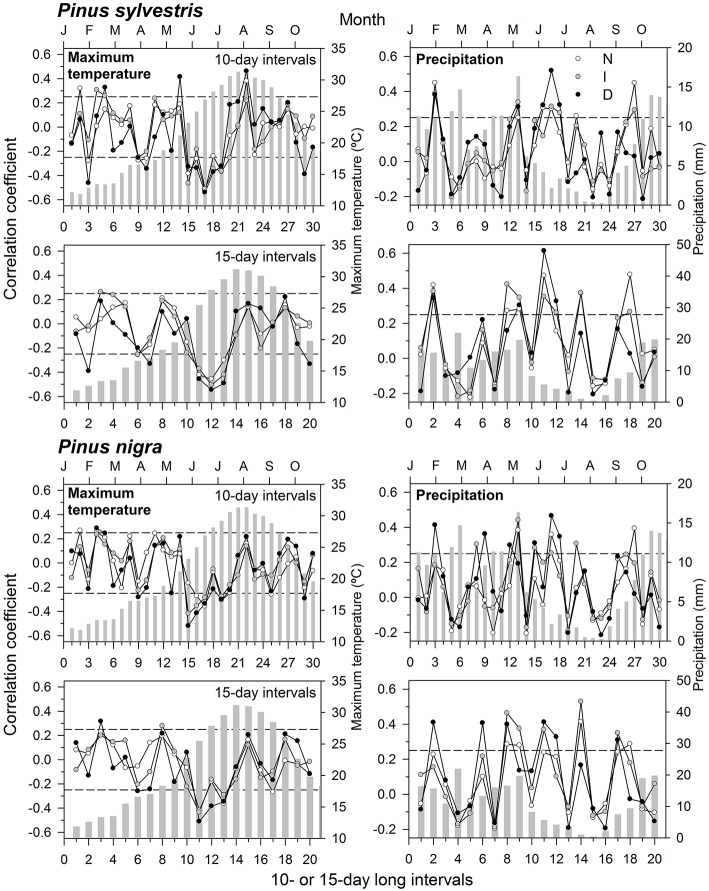
Figure 2.
Climate-growth relationships (Pearson correlation coefficients) calculated for the two pine species and considering three defoliation degrees (N, scarce or no defoliation, empty symbols; I, intermediate defoliation, gray symbols; D, severe defoliation, black symbols). Correlations were obtained for 10- and 15-day long intervals considering the 1985–2008 period, and they are presented for mean maximum temperatures and total precipitation. The dashed lines indicate the 0.05 significance levels. The bars show averaged (temperatures) and summed (precipitation) values for each variable.

