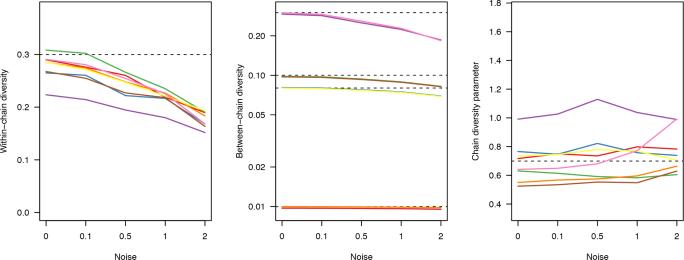
Figure 11.
Posterior median estimates for genetic diversity parameters under different levels of genetic distance error. Matrices were perturbed by adding a Poisson-distributed ‘noise’ variable to each pairwise distance; we considered expected errors of 0.1, 0.5, 1 and 2 SNPs. Each coloured line corresponds to a different simulated scenario, with varying transmission rates (β=0.005, 0.008) and between-chain diversity values (γG=0.01, 0.08, 0.1, 0.3). True values of parameters are indicated with dashed horizontal lines; four different levels of γG were used.

