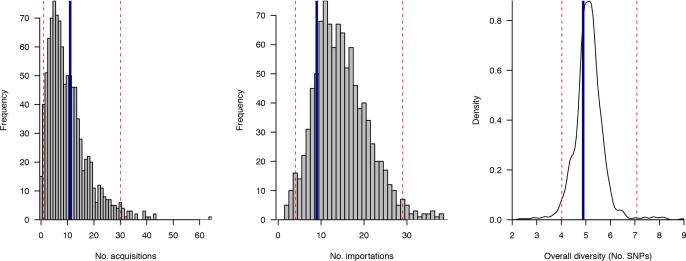
Figure 12.
Posterior predictive distributions for number of acquisitions (left) number of importations (centre) and the overall average pairwise diversity (right). Values observed from the Rosie hospital dataset are marked as vertical blue lines, while the bounds of the 95% central quantile of the posterior predictive distribution are marked as dashed red lines.

