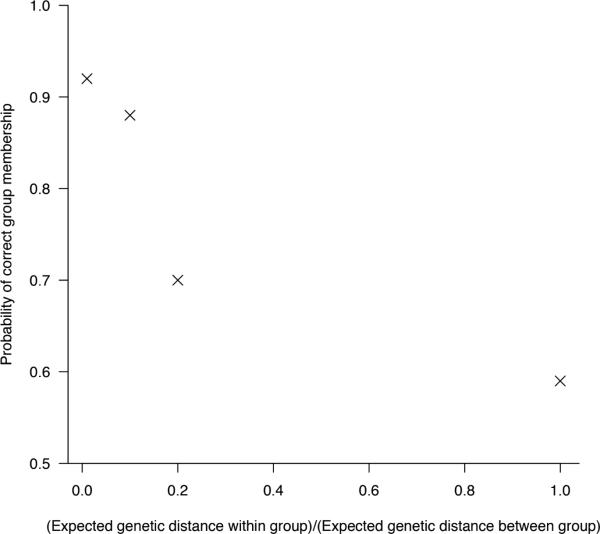
Figure 3.
Group identification under importation structure model. Data were simulated under a range of within and between group genetic distance distributions, and we estimated the posterior probability that the importation structure model placed an infected individual in the correct group (belonging to the same group as the first importation of that group). Baseline scenario: p = 0.05, z = 0.8, β = 0.005, c = 0.2.

