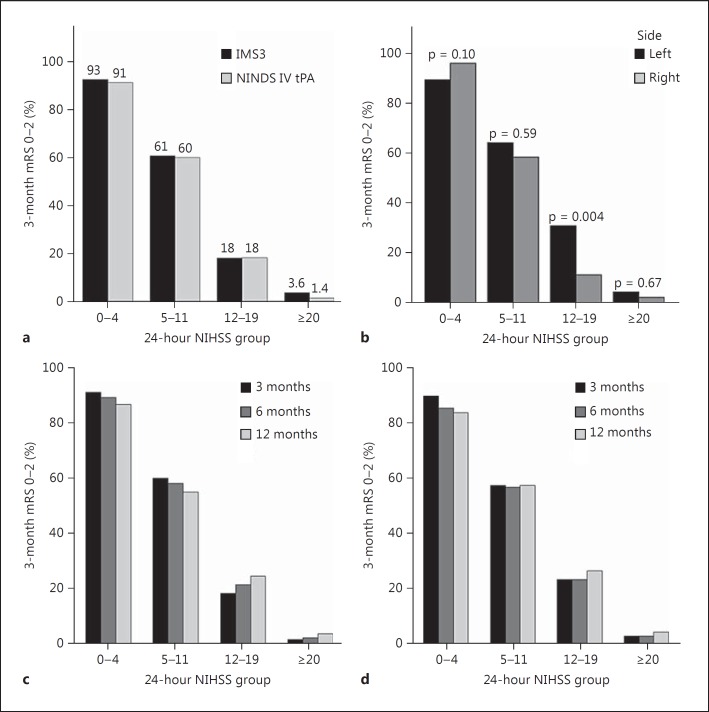
Fig. 3.
Risk quartiles based on the 24-hour NIHSS. a Comparison of observed rates of 3-month good outcome (mRS 0-2) in IMS3 and NINDS IV tPA cohorts. b Observed rates of good outcome (mRS 0-2) based on stroke laterality in IMS3 (p values calculated based on χ2 or Fisher's exact test are reported). c, d Comparison of 3-, 6-, and 12-month rates of good outcome in the NINDS IV tPA trial across 24-hour NIHSS risk quartiles.

