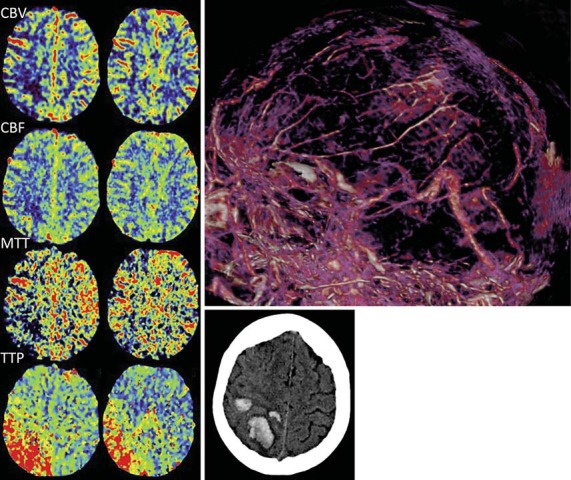
Fig. 4.

CT perfusion maps (left) from case 9 display focally reduced CBV, CBF, and MTT in the right frontal area corresponding to the location of the hematoma that is shown on noncontrast brain CT imaging (lower right). The TTP is increased in the right frontal and parietal regions. Thrombosis of the superior sagittal, right transverse, and right sigmoid sinuses is seen on the CT venogram (upper right).
