Figure 3.

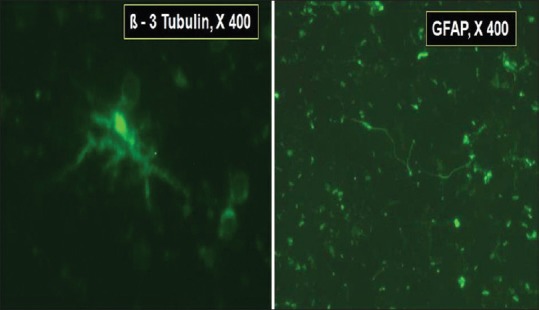
Photomicrograph of neuronal stem cells exhibiting ß-3 tubulin (×400) on left and glial fibrillary acid protein (×400) on the right, by immunofluorescence staining

Photomicrograph of neuronal stem cells exhibiting ß-3 tubulin (×400) on left and glial fibrillary acid protein (×400) on the right, by immunofluorescence staining