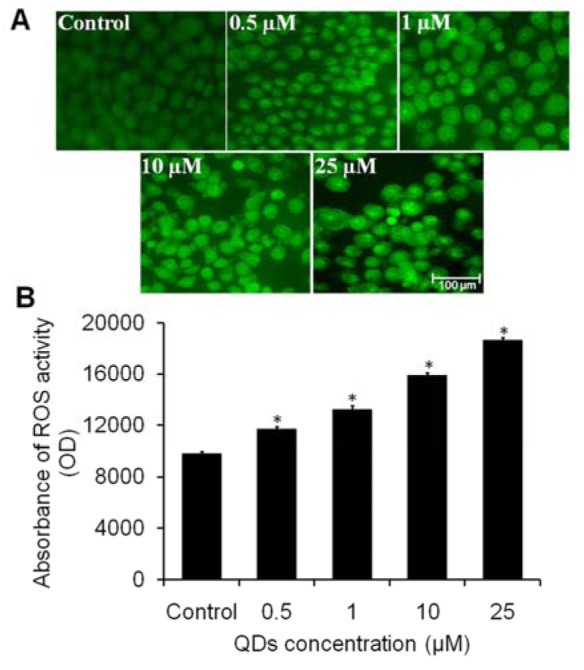
Figure 4. Effect of highly active CdSe QDs1 at different concentration (0.5-25 μM) on ROS production in A549 cells. (A) Photomicrographs showing intracellular ROS generation at different concentrations of QDs after 6 h incubation. Photomicrographs were taken with a florescence microscope. Scale bar=100 μm. (B) Graph showing extent of ROS generation with respect to the control. Values are expressed as the percentage of fluorescence intensity relative to the control. Values are expressed as mean ± SEM of at least three independent experiments, *p < 0.05 as compared with their respective control.

