Fig. 6.

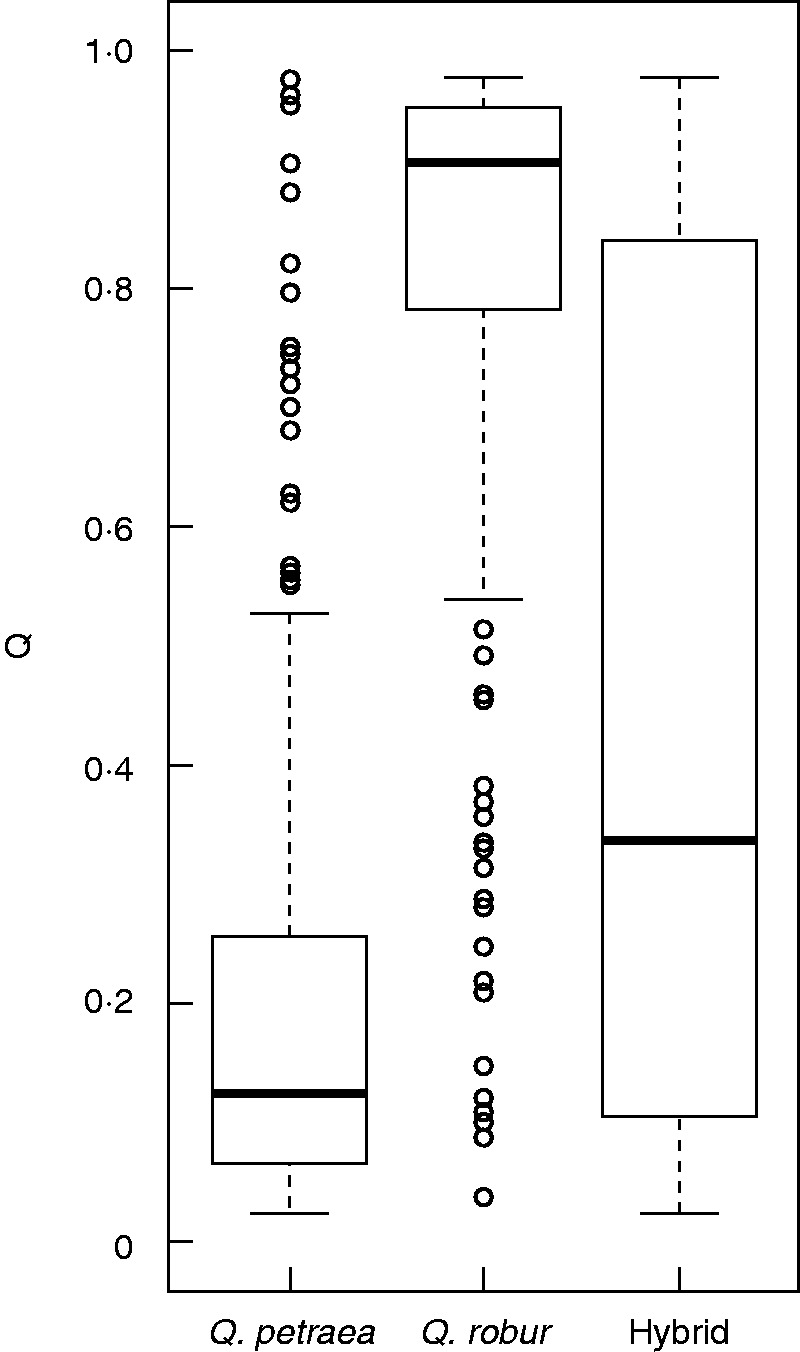
Boxplot showing admixture coefficient (Q) values for Quercus petraea, Q. robur and hybrids. The solid bar represents the median.

Boxplot showing admixture coefficient (Q) values for Quercus petraea, Q. robur and hybrids. The solid bar represents the median.