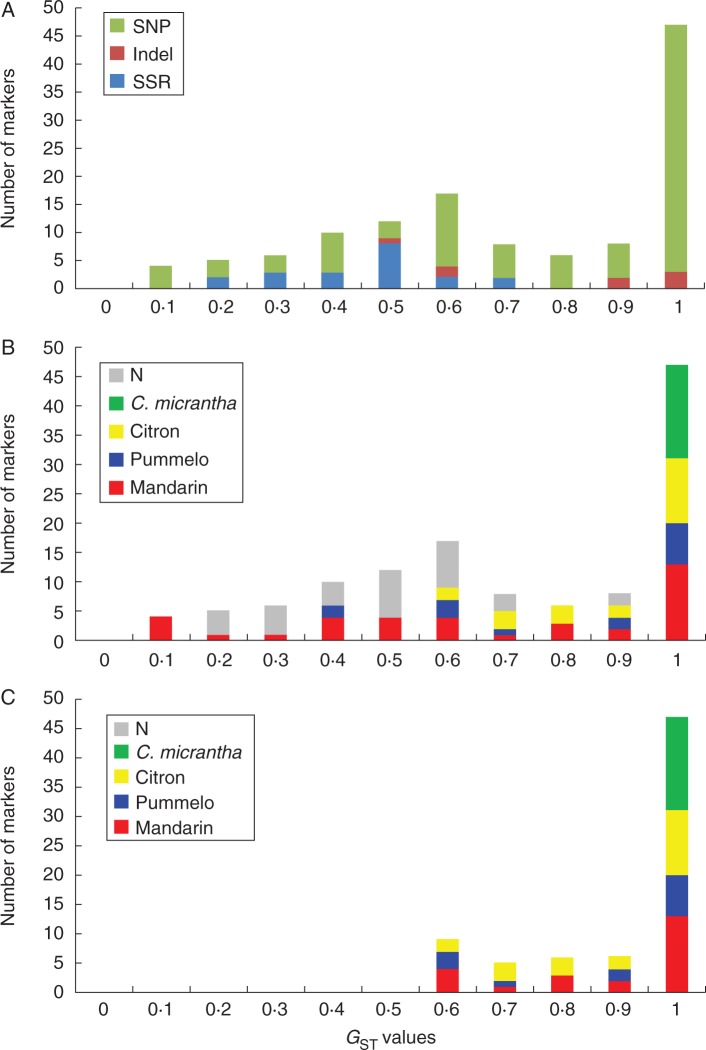
Fig. 2.
Distribution of the highest specific GST values. (A) Comparative distribution of the three kinds of markers [simple sequence repeats (SSRs), indels and single nucleotide polymorphisms (SNPs)]. (B) Diagnostic value of the 123 markers for the ancestral taxa. (C) Diagnostic value of the 73 selected markers for STRUCTURE and specific allele homozygosity/heterozygosity (Hom/Het) analysis of the ancestral taxa. N, non-diagnostic markers.

