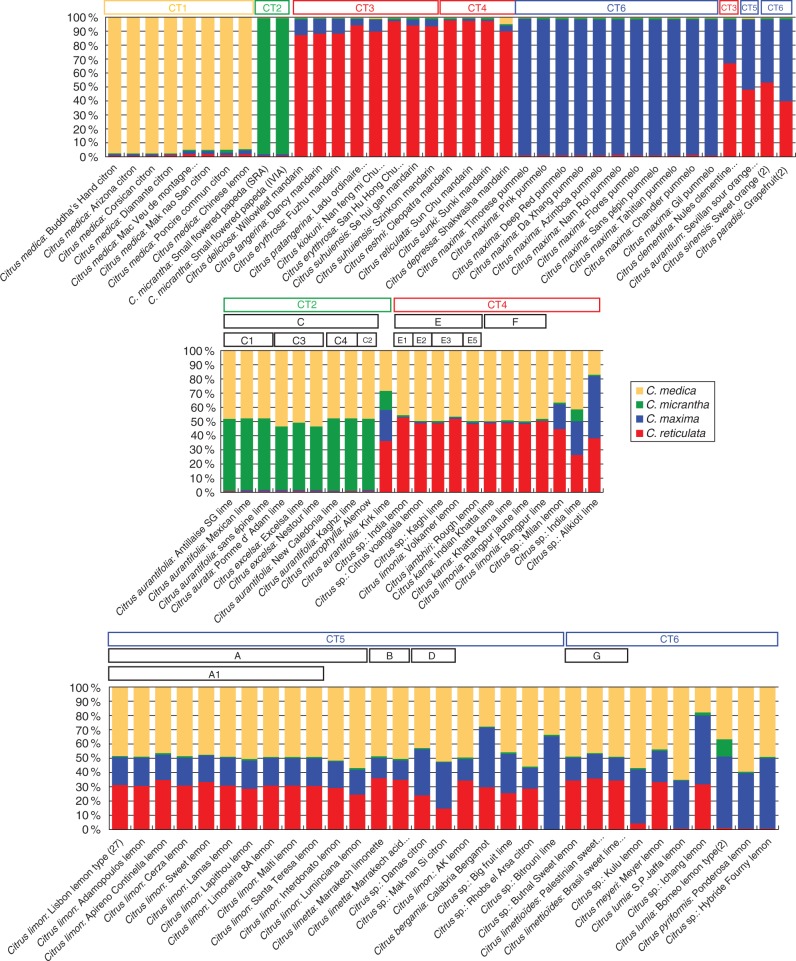
Fig. 3.
Percentage contribution of the four ancestral taxa to the 90 MLGs. STRUCTURE analyses using 73 indels and SNP markers (average values for ten runs with K = 4) (blue, Citrus maxima; red, C. reticulata; green, C. micrantha; yellow, C. medica). The boxes at the top of each panel show the distribution of lemons and limes in the different nuclear clusters and sub-clusters (A–G) and the different types of cytoplasm (CT1–CT6)

