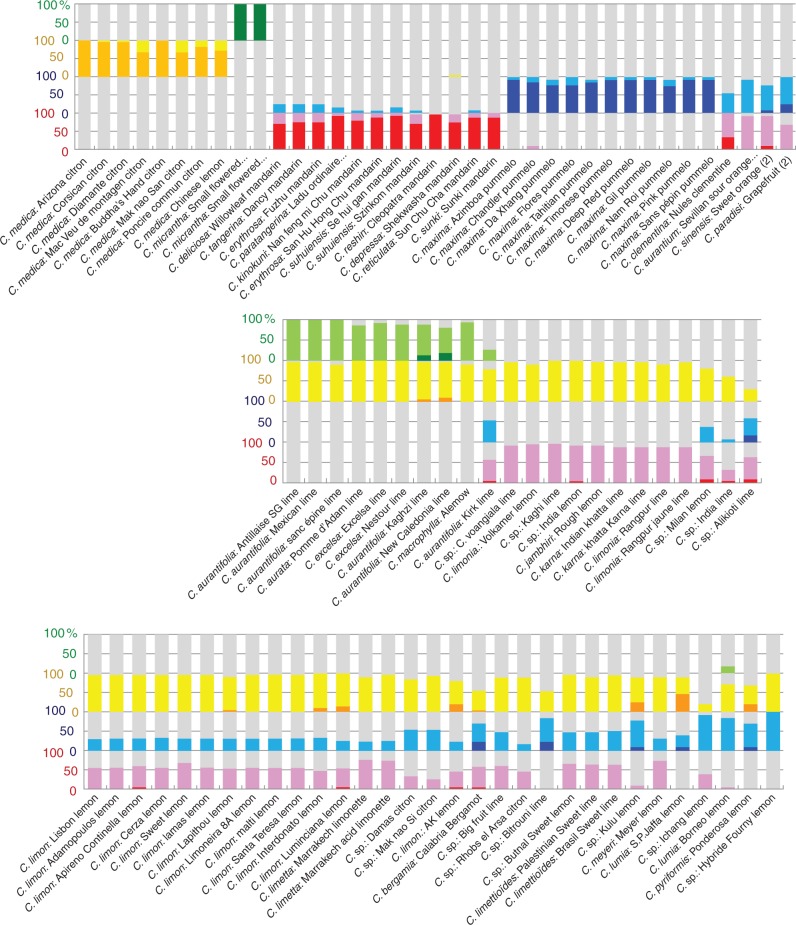
Fig. 4.
Contribution of the four ancestral taxa to the 90 MLGs. Analyses of the frequency of homozygosity and heterozygosity (%) using the four specific sets of diagnostic markers (total of 73 specific markers). Orange, C. medica homozygosity; yellow, C. medica heterozygosity; red, C. reticulata homozygosity; pink, C. reticulata heterozygosity; deep blue, C. maxima homozygosity; light blue, C. maxima heterozygosity; dark green, C. micrantha homozygosity; light green, C. micrantha heterozygosity).

